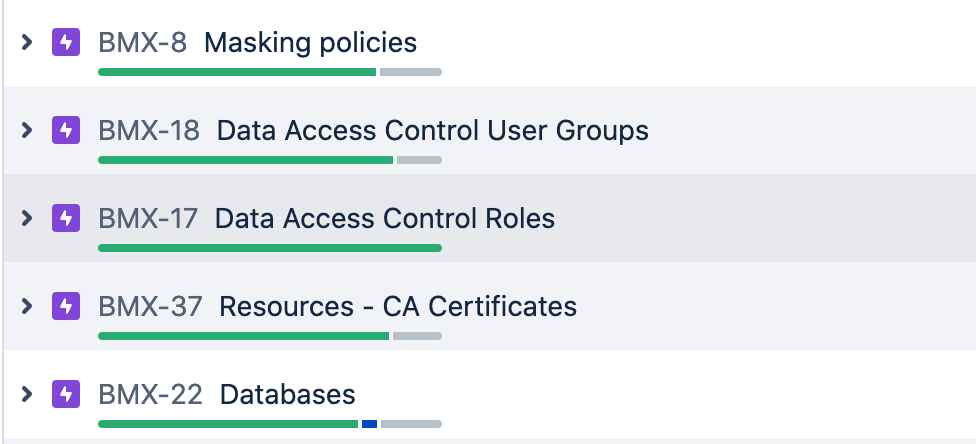
Is there a way to display the following chart, found on my roadmap, in a dashboard? I would like to show a list of certain epics, with the child issues displayed in this progress bar. Looks like the data is readily available, and the problem is displaying it appropriately.