Hi everyone,
I want to know if the following workflow is possible in Jira. We're exporting data from a project into excel. There, we calculate the average story points for all the stories we estimated, and the average amount of stories per Epic. We then get the number of epics with no story, and multiply that by the average amount of stories per epics, and then by the average story points per story, adding that to the total story points of epics with stories and story points that we did not worked yet. With this, we have an estimation of the total points for the project.
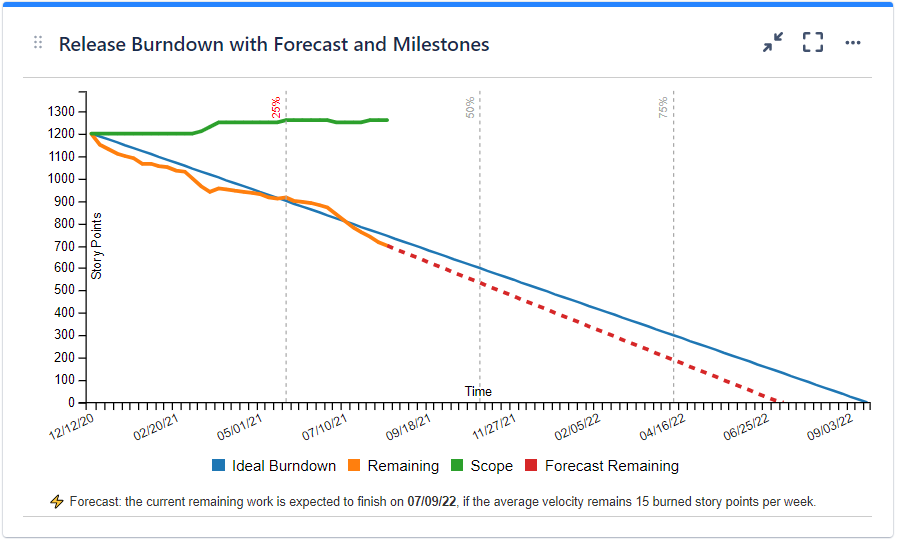
Finally, we divide this total number of estimated points by our teams velocity, and plot it by date (or sprint start date), to visualize what's our end date estimation.
Can we create this custom metric in Jira, without having to export the information to excel, and then plot it by date so it automatically refresh when a story or epic is updated?
Thanks!