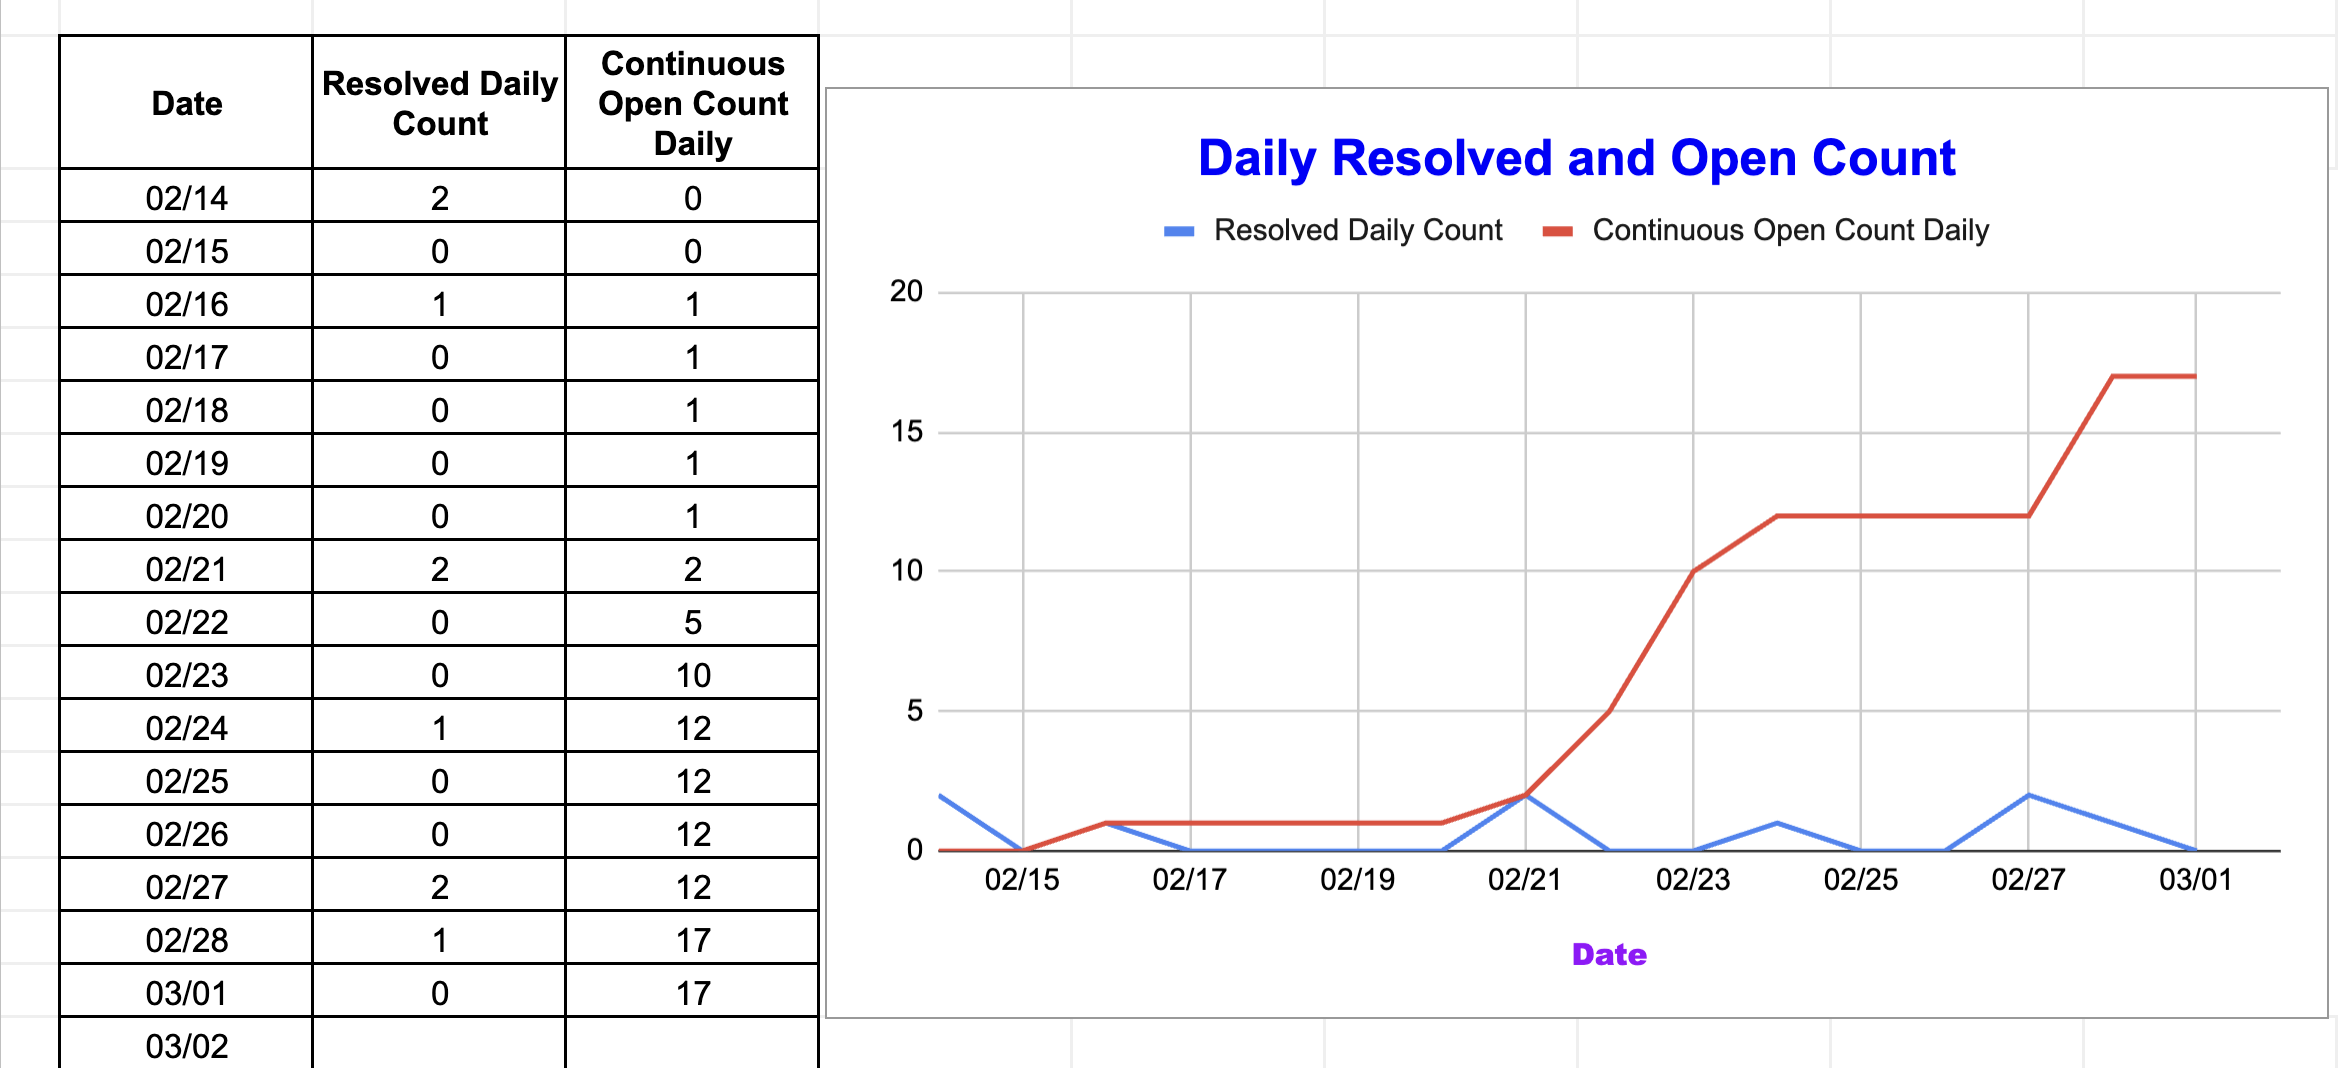
Is it possible to show the daily count of open vs resolved tickets in a single chart as individual trend lines?
I am sure this question has been asked a zillion times now. Please don't point me to created vs resolved chart because I am not looking for what has been created, but rather what's open in a particular day. I have tried that gadget and pretty much everything that is provided out-of-the-box. Its surprising to see something this basic not available out-of-the-box, unless I missed it in my exploration. Any help is highly appreciated, because currently I am creating this chart in Excel after running the right queries for each (open and resolved) daily. So, cannot embed in my existing dashboard with other gadgets.