Hello,
I would like to ask for an advice, how to realize followings:
As a part of Confluence page, I want to create a table containing values describing status of list of test cases. Each case has status PASSED/FAILED/etc. ... I want to create additional column or table with overall count of PASSED, count of FAILED, ... and display it in a pie chart.
Something like this: 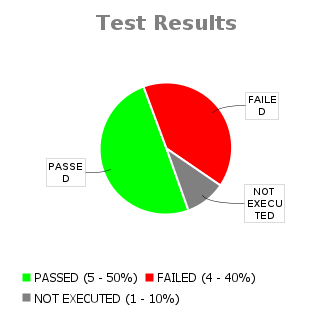
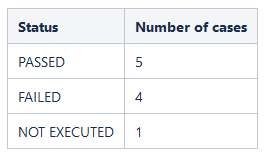
I tried to use Chart Macro, it creates the chart on picture. But problem is with the table. Standard table in Confluence can not use formulas, so the table on picture is manually filled. I tried to insert excel file with the table, but it seems to be not compatible with usage within the Chart macro.
Please, any idea how to solve such a task?
Thanks in advance for any help.

