I have a table with the Jira ticket number, start date, and end date.
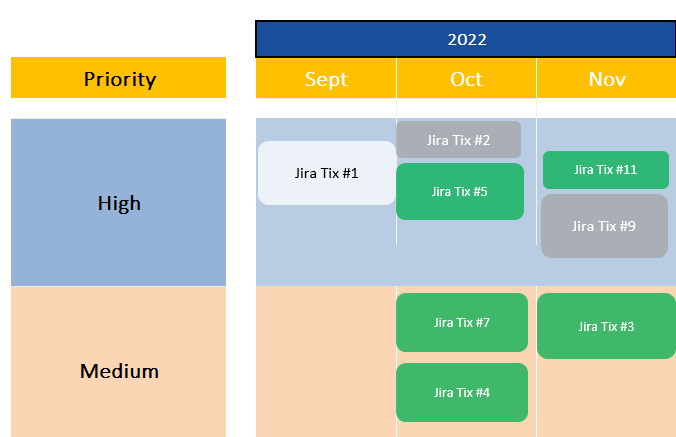
I would like to create a timeline/roadmap (not sure right name) that will visually display the tickets across time. See below.
The closest solution I found is macro: 'Chart from Table" > Gantt. However, I want users to be able to click on the Jira ticket number and it be a link to the actual ticket.