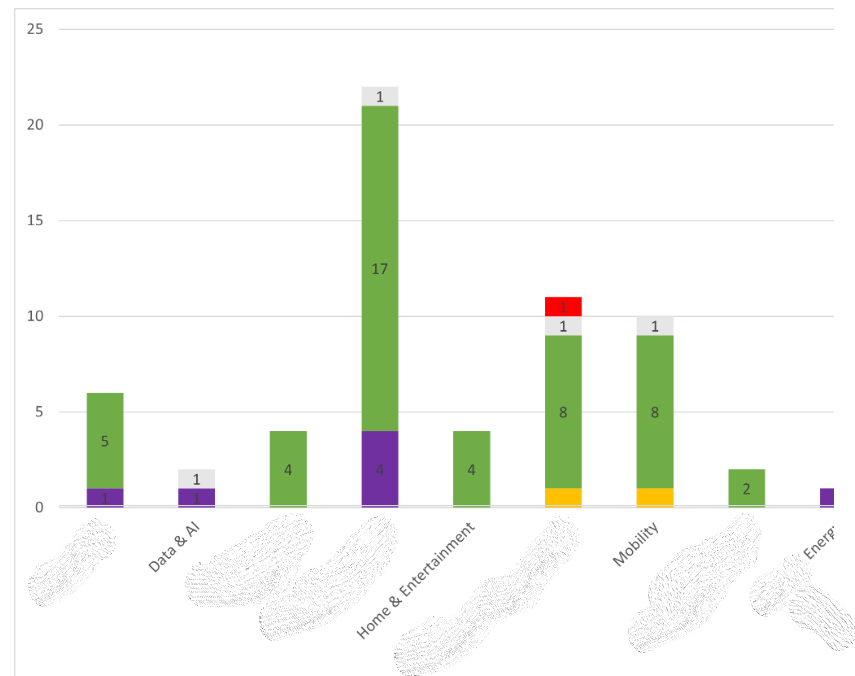
On the Dashboard, I would like to create a bar chart with count of 'something' as values on Y-axis. I would like to do this without using any extensions, so that for Dashboarding I don't have to go out of JIRA to any other application (like Power BI, or eazyBI etc.)
Attached is a picture of the graph I would like to create in JIRA.