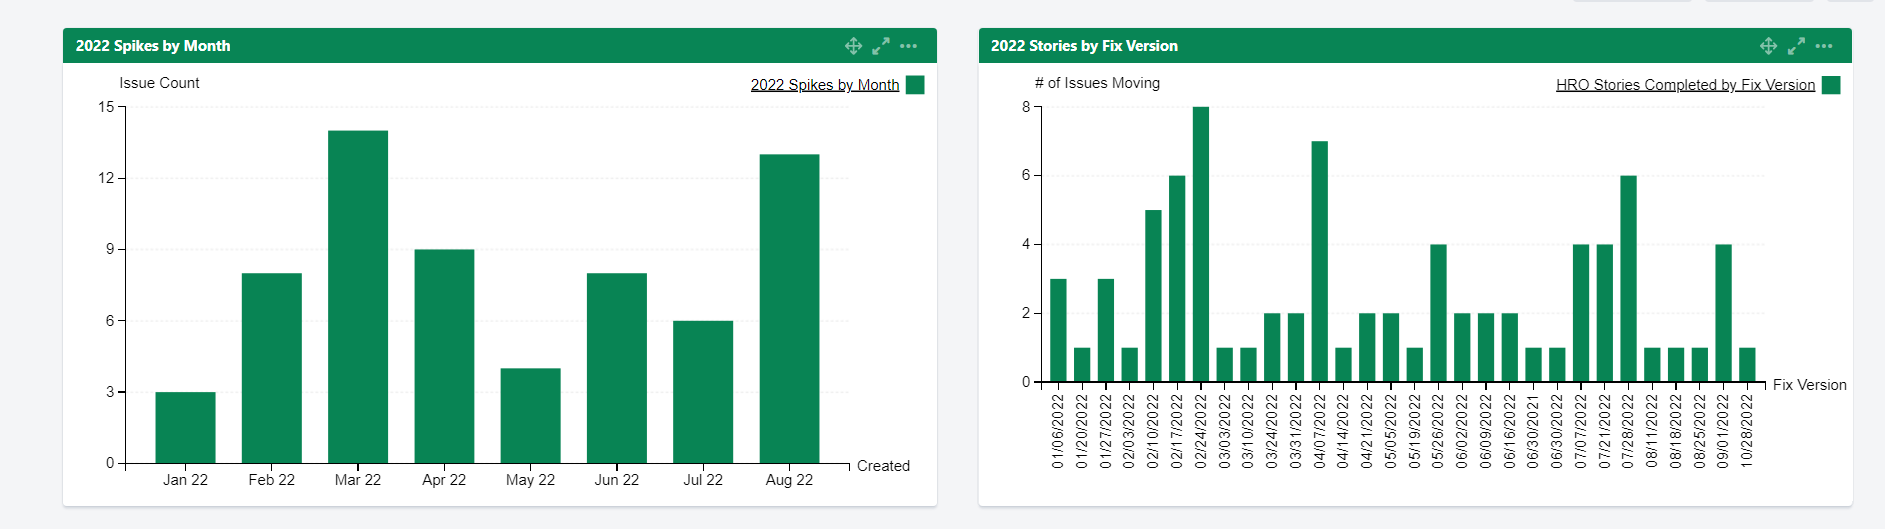
Hi Everyone!
I am currently working on creating a dashboard for my team, and I'm running into an issue when I try to get one of my bar charts to show work completed in two week increments rather than monthly. Currently, I have two separate bar charts: the first one tracks Stories by Fix Version, and the second tracks Spikes resolved. My boss is looking to get more granular with the spikes so that instead of the chart showing the total number of spikes resolved each month of the year, it shows spikes completed in two week increments. The problem I'm running into is that our spikes do not have fix versions associated with them, so my chart is only pulling in every spike resolved in the respective month.
The JQL I have for my spikes is: project = "Technology Services HR Delivery" AND component = HRO AND issuetype = Spike AND duedate is not EMPTY AND duedate >= 2022-01-01 AND duedate < 2022-12-31 ORDER BY duedate ASC
I've also attached a screenshot of both bar charts I'm talking about for a visual. If anyone has any recommendations for me, I welcome any and all feedback!