Hi Everyone,
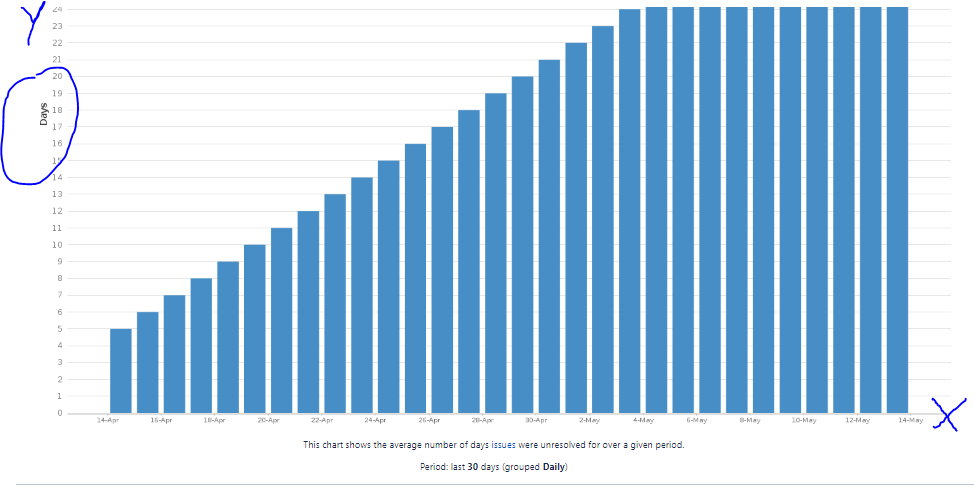
I want to create a Graph in Dashboard in which
i have to see two filters
in Y axis the Task counts
and in X axis "Assignee names"
in this Below image for e.g i have used "Average age chart"
so that we can have a picture of which assignee as done with how many Tasks
This is what i want to achieve
kindly provide any solution like any JQl query need to add or anything else