Hello!
I am using the backlog prioritisation metric on my tasks that define things such as reach, impact and effort.
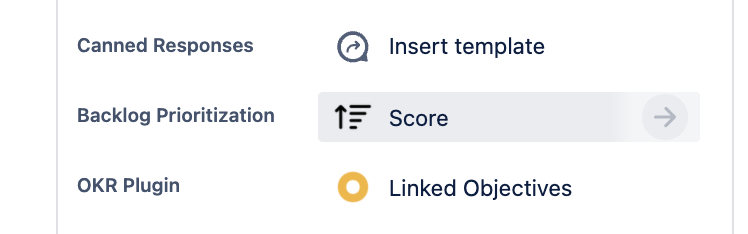
I can visualise the things in the "backlog prioritisation" tab. But I would like to visualise these metric in a dashboard.
When I use a gadget such as "Filter xx", it doesn't seem that these metrics are available to view.
How can I visualise backlog prioritisation metrics on a dashboard?


