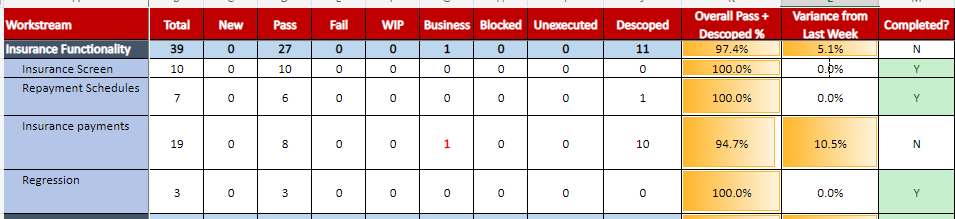
Currently use a very manual way of reporting using excel, but am looking for a way to report 'weekly % variance' for key areas in JIRA Dashboards.
As well as overall % test progress.
The add-ons i've found and tested with so far only show weekly numbers, not percentages.
I really need to be able to see weekly % progress as it is a hugely crucial metric for the projects we have.
example below, apologies its a bit long winded but struggled to explain it any shorter.
EXAMPLE:
Areas = Savings (10 tests). Loans (20 tests).
Week 14/02/2022 to 18/02/2022
5 Savings Tests =Pass/Done
5 Loans Tests = Pass/Done.
[so 50% of savings tests passed in week 1. Savings=50% progress, and 50% Variance from last week.
25% of loans tests passed in week 1. Loans = 50% progress, and 50% Variance from last week.
Overall Test Progress = 33%]
Week 21/02/2022 to 25/02/2022
5 (more) Savings Tests =Pass/Done.
10 Loans Tests = Pass/Done.
[So 50% of savings tests pass in week 2. Savings = 100% progress, and 50% Variance from last week
50% of Loans Tests passed in week 2. Loans = 75% progress, and 50% Variance from last week
Overall Test Progress = 83.33%]
Below is a small excerpt from an existing xls I use