Dear Community,
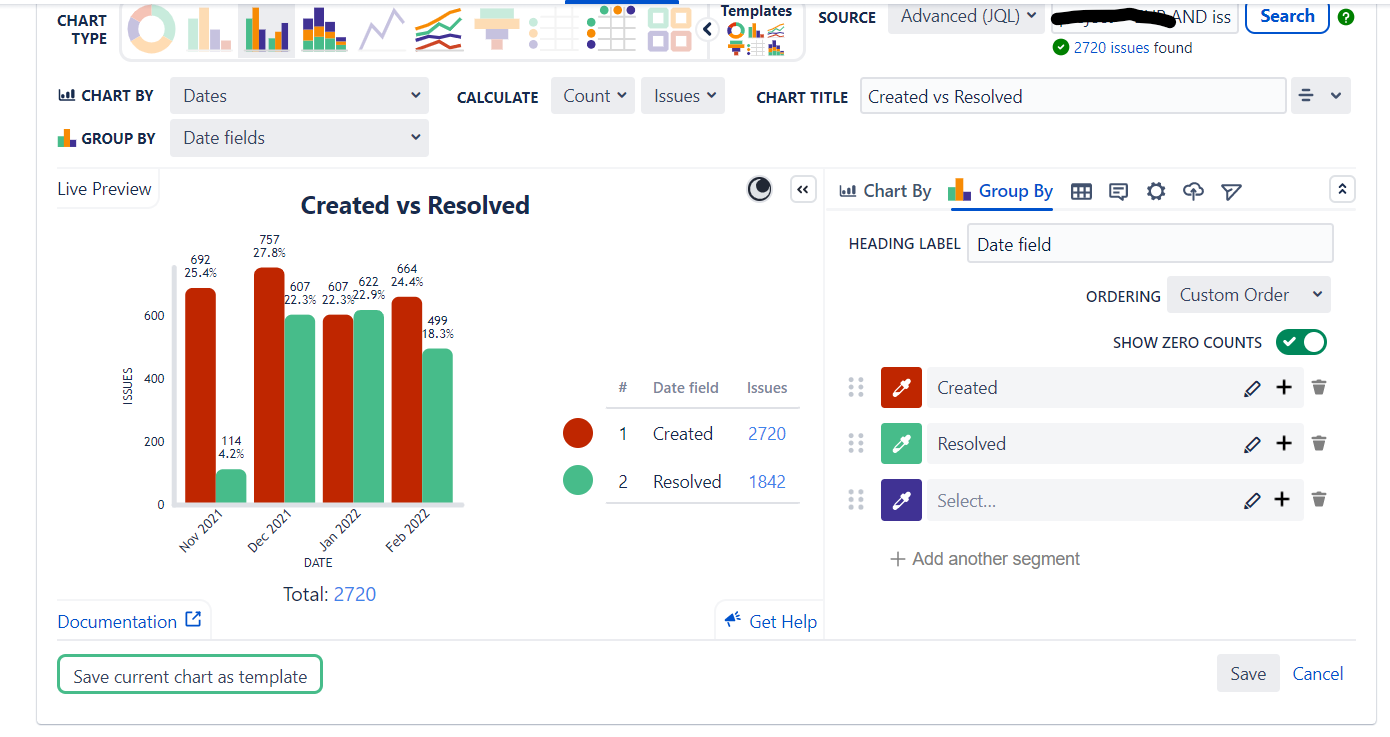
I have a chart below that displays the total number of created ticket per month and resolved ticket per month.
I would like to further enhance this report by adding another bar that display total of tickets that is resolved whereby the ticket was created last month.
For example:
10 tickets created on January, but only resolved on February. So on the column February will have an additional bar that display 10 records.