Hello.
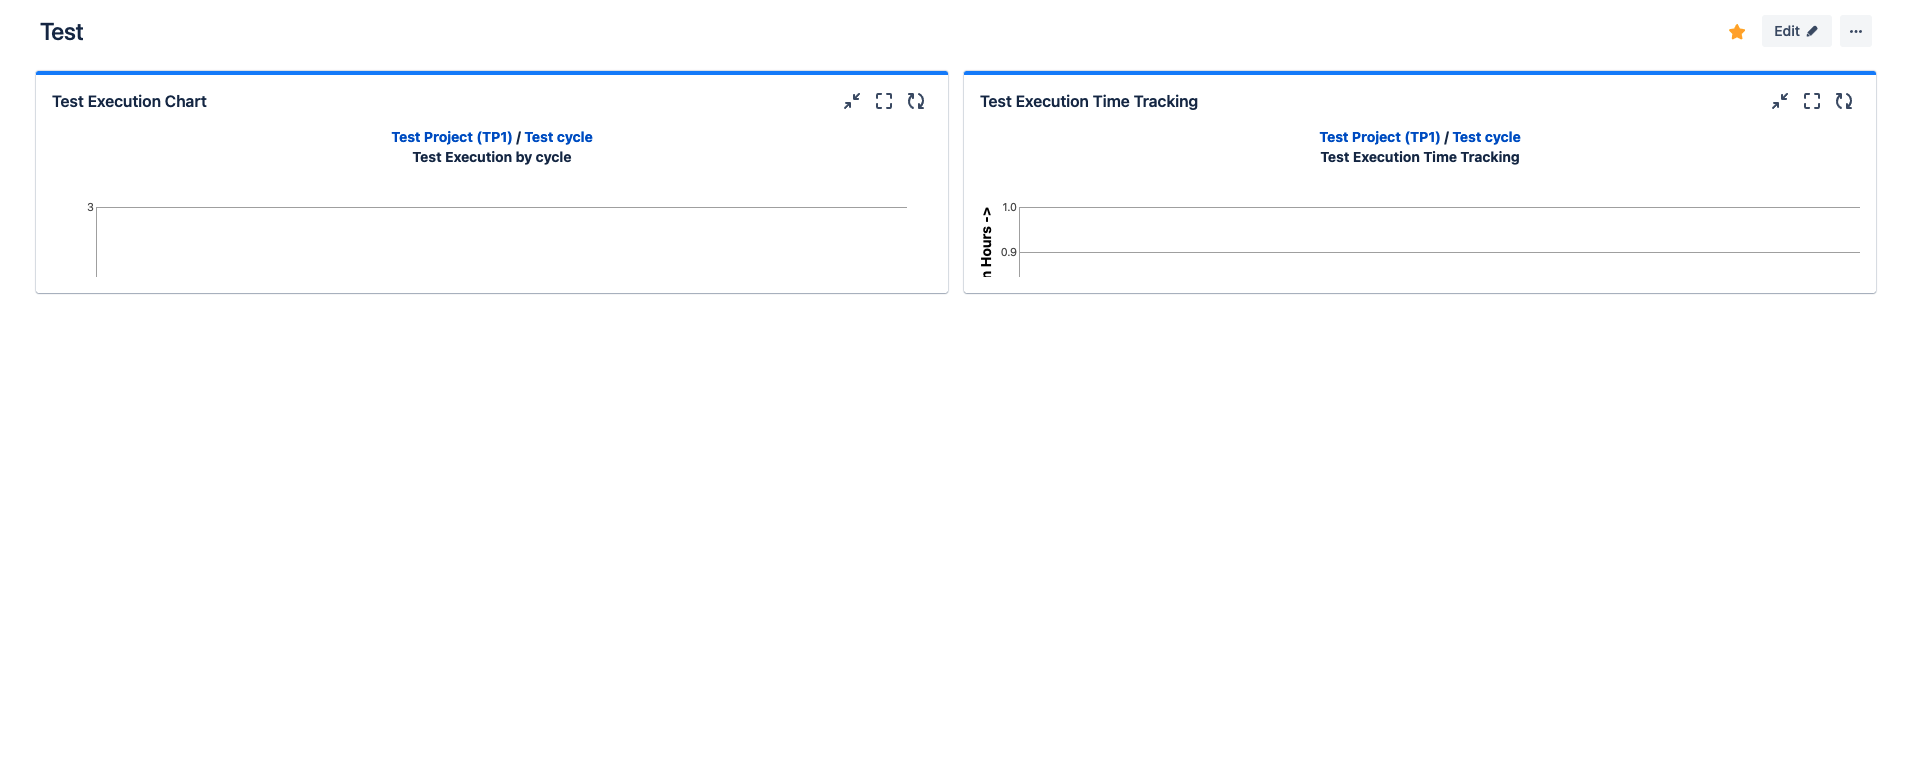
I've added a couple of Zephyr test execution monitoring gadgets to my dashboard and the styling isn't right i.e. I have to scroll down the area the gadget is in to get a view of the graph.
Does anyone have any suggestions here on how to get a full view of the graph?
Thanks