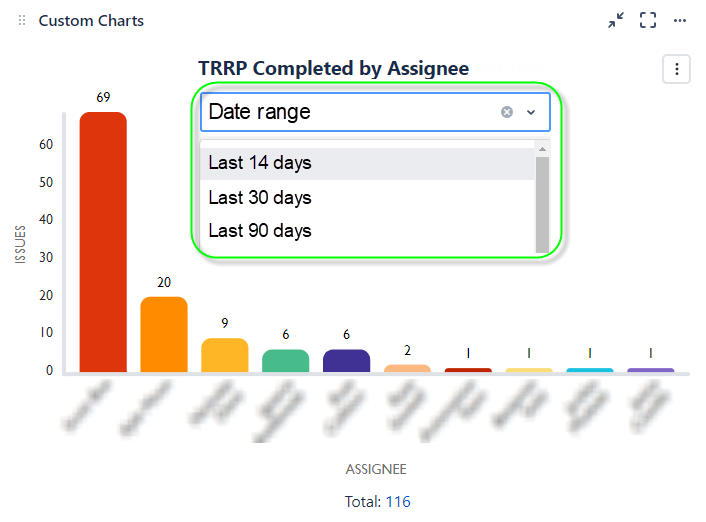
I'm creating some new dashboards and would like to see issues resolved by assignees for different time periods. Instead of creating 3 charts for the last 14 days, last 30 days, and last 90 days, is there a way to incorporate a dropdown filter on a single chart with those values? Something like the image below?