Page Load Trends
This graph shows Jira Align page load performance trend version to version. The x-axis shows the areas under test color-coded to the production version. The y-axis shows page load times in seconds.
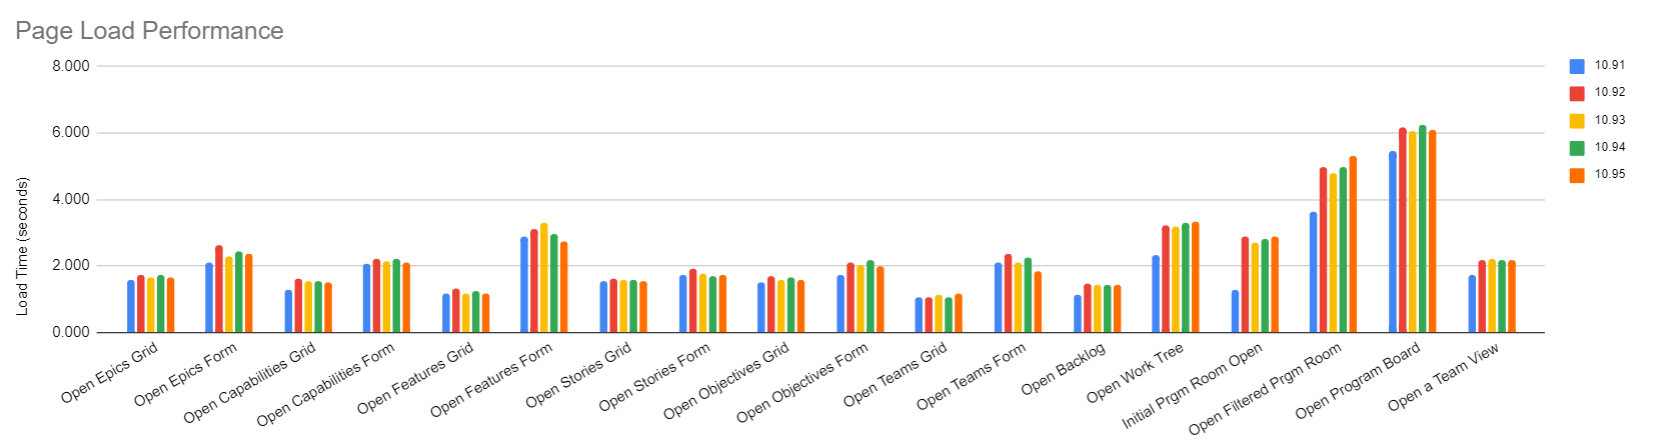
Page Load Times in Seconds
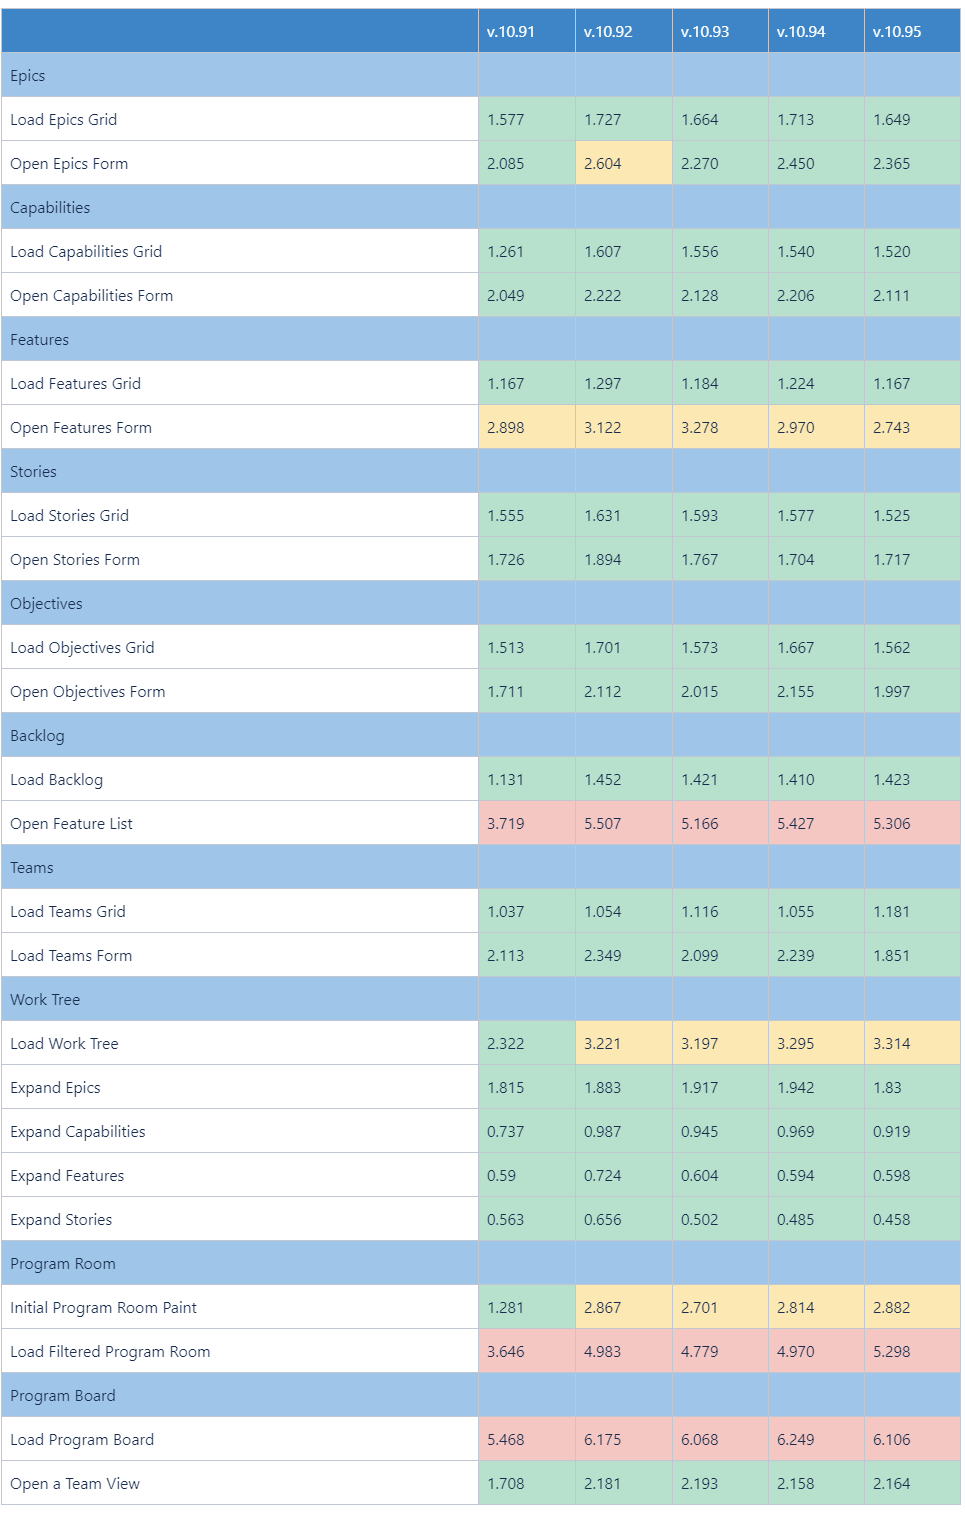
This table shows Jira Align page loads time in seconds. Our goal is for all pages within the application to load within three seconds. The cells are color-coded to easily show where we beat, meet, and miss our goals.
Data profile
We are actively working to expand our performance dataset and will update this section as we add more work items and hierarchies.
Work Items
-
Themes: 40
-
Epics: 400
-
Capabilities: 1,600
-
Features: 6,400
-
Stories 64,000
-
Objectives: 586
Work Hierarchies
-
Portfolios: 1
-
Programs: 4
-
Teams: 415
-
Program Increments: 99
-
Sprints: 1,333
-
Users: 50,500
Test Environment
Hardware of system under test
For more context how we gather our performance metrics please visit - Jira Align Performance Benchmark

