I need to create a report which compares the number of tickets for various components over each of the past few months. It would be like viewing several monthly component pie charts all at once, something like this:
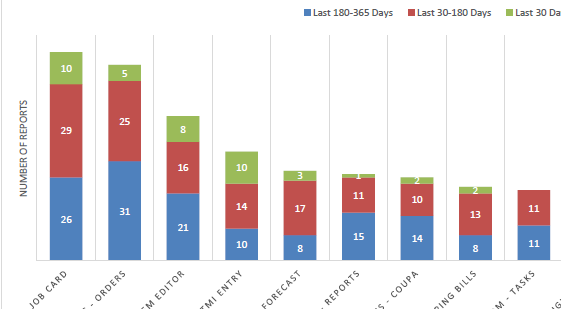
I haven't yet found an option in creating reports that allows this, but it must be possible.
thanks
John

