Hi,
Thanks everyone for your attention on my issue.
I'm using following table to generate a chart
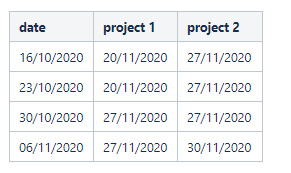
Basic idea is to track the delivery estimations for multiple projects over time.
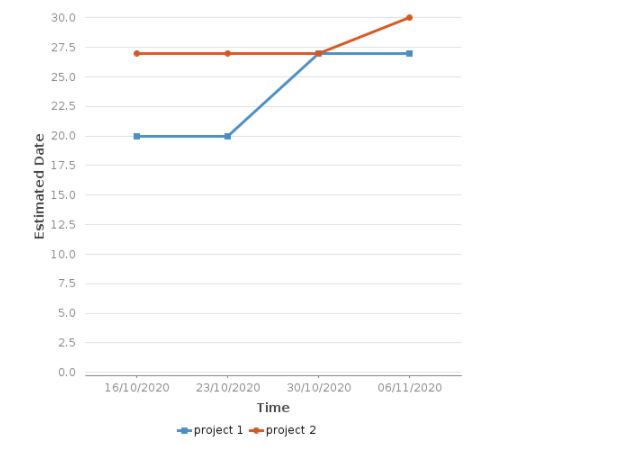
This is the generated chart. As you can see my project 1, project 2 columns are not picked up as date values rather decimal values.
Is it even possible in line chart options to have a date value y axis ?