Hi
I have a question on how to display data in charts in jira cloud. I tried looking for this in internet but could find an answer. So here is the question:
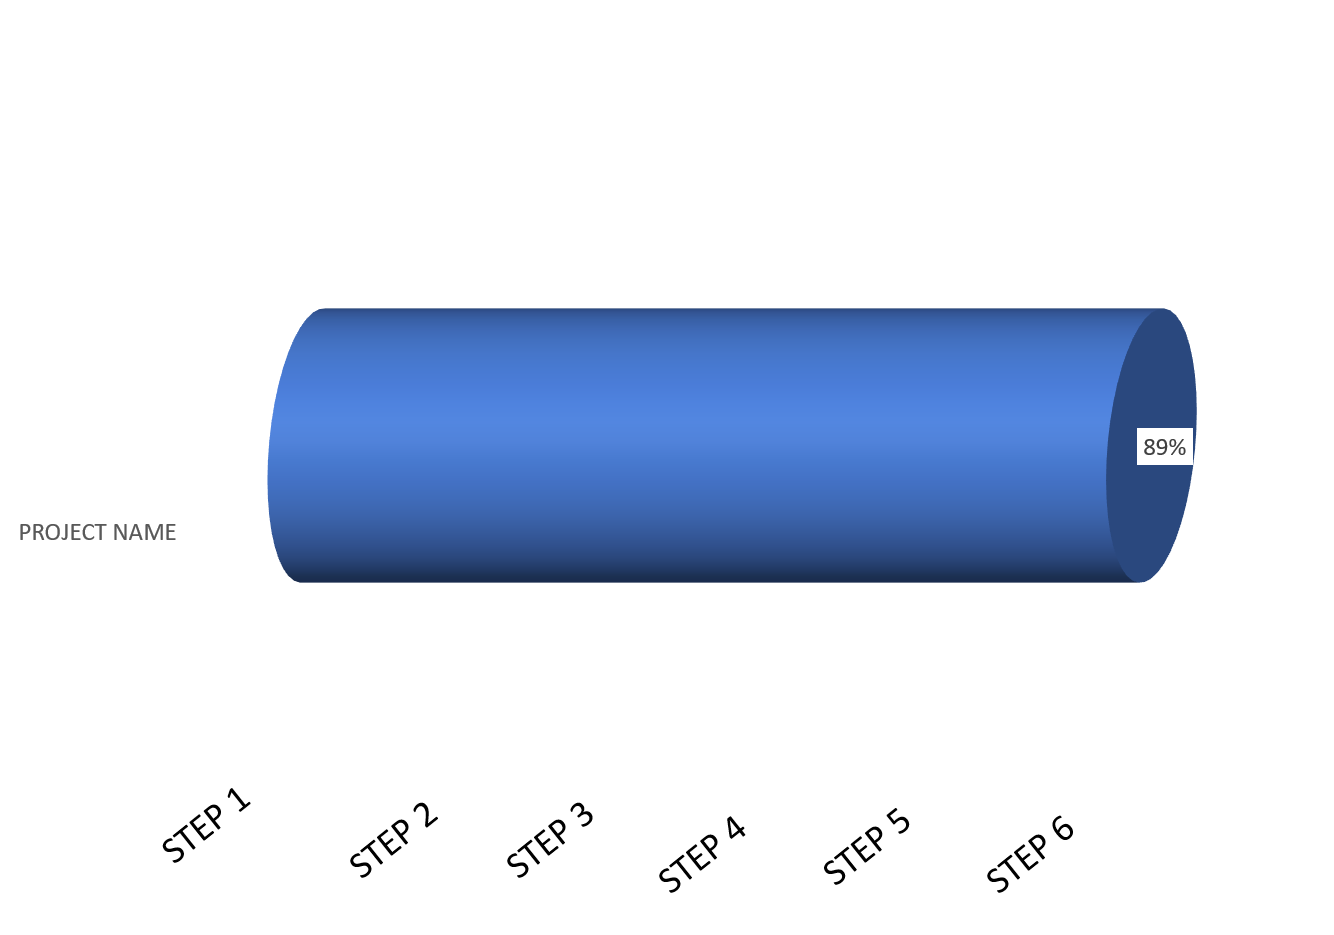
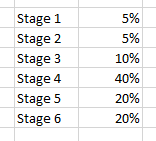
I have a jira board (picture 1). I would like to show the progress of this epic through different stages as shown in picture 2. I would also like to know if there is a way to assign a percentage value to each stage (picture 3) and show it in the graph. The graph does not have to look exactly like in picture 2 but the general idea of being able to show progress through different stages would be helpful. Can this be done in jira cloud? And can this chart be displayed in confluence cloud? Any help is highly appreciated. Thank you.