Hello,
We are trying the Advanced Roadmap, and I'm showing the fields "due date" and "target end date"
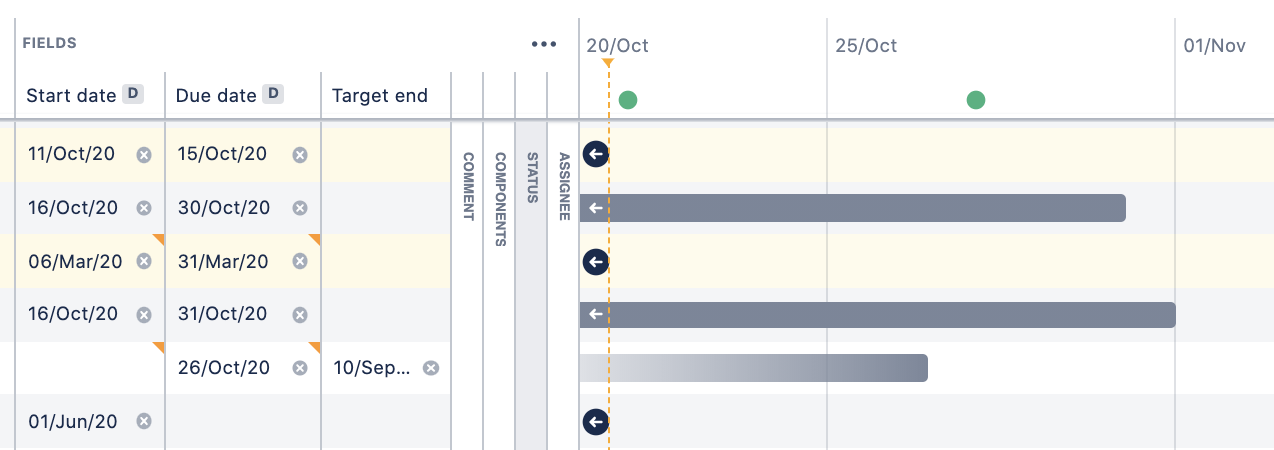
However, I'd like to clearly visualise on the graphical part at the right both dates with a red part between both dates. As a team, this would help us see at a glance what is overflowing to trigger problem solving.
I suspect this is not included yet in the product. Since I'm a developer, I could code an extension to the Advanced Roadmap (either a browser extension or through an Atlassian plugin) so that I can visualize it. Where do I start and do you have recommendations?
Thank you


