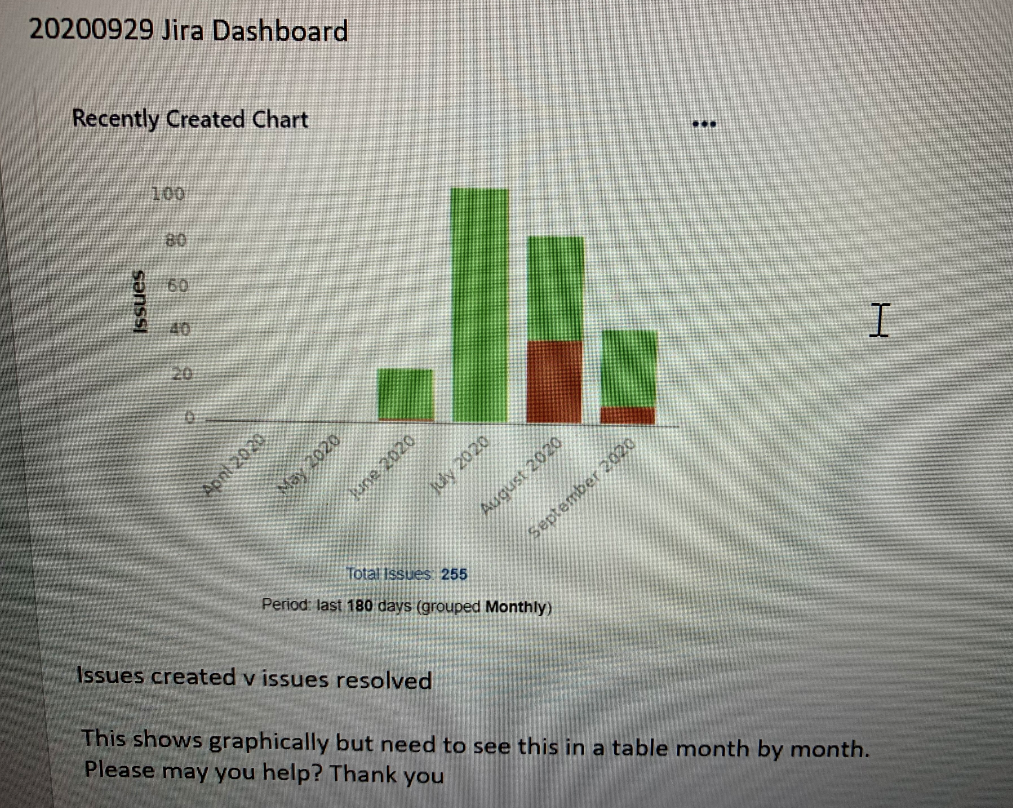
We have recently incorporated Jira into our workflows and would like to know if there is a way that I can display our data into a figures table to compare month by month and show trends:
This shows graphically but need to see this in a table month by month..... Please may you help? Thank you