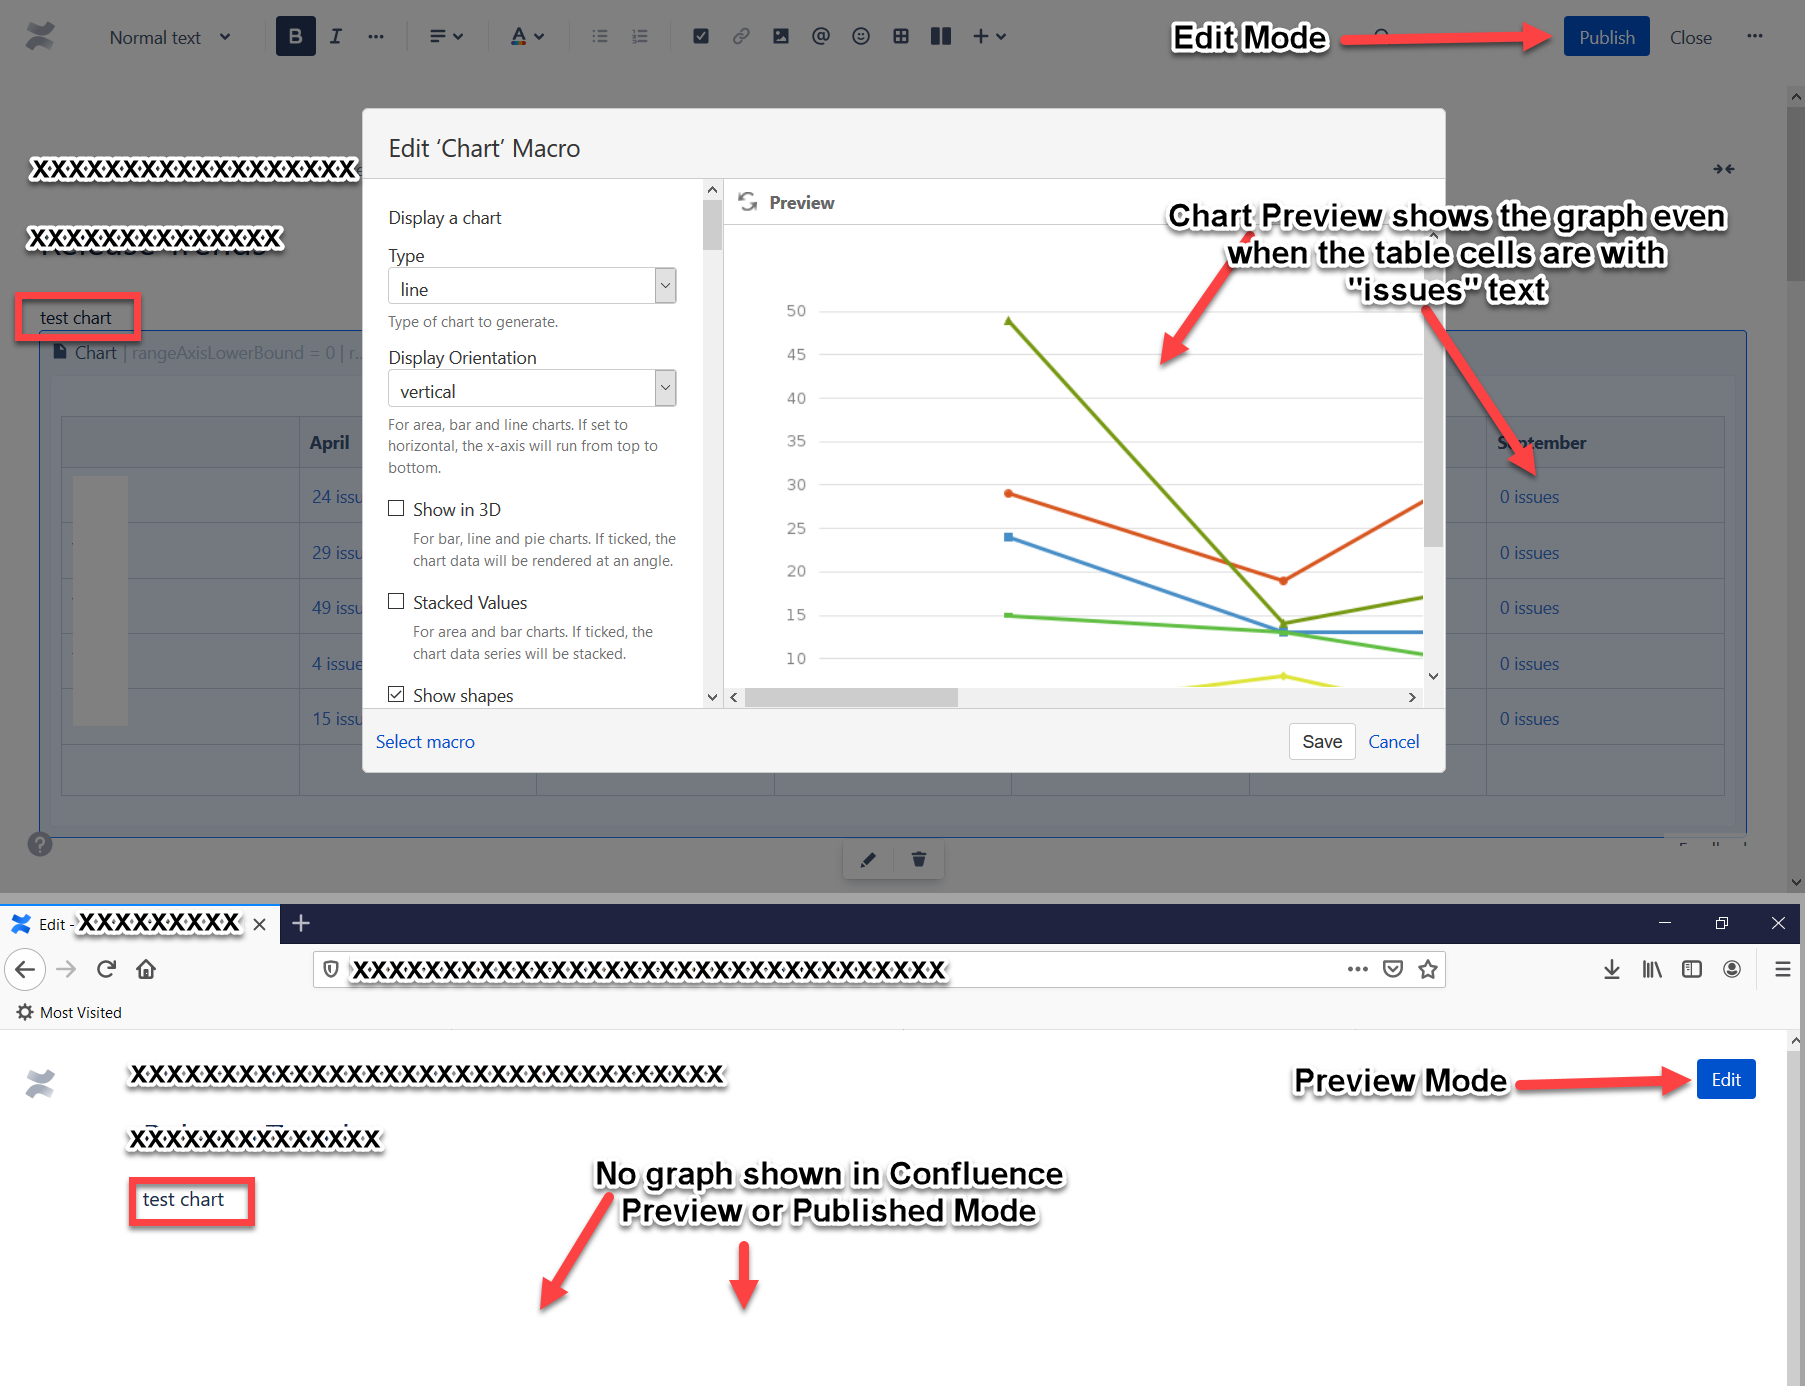
I am trying to use Chart Macro with the table of content generated using Jira Issue/Filter macro with "Total Issue Count" display option. I can see the Chart Preview correct, but when the page is previewed/published, it does not show any graph.
The issue seems the Preview/Published page is not able to generate the chart for "x issues" cell values.
Can you please let me know if this is chart issue and is there any way to show the Total Issue Count in the table, with only number (without Issue text)?