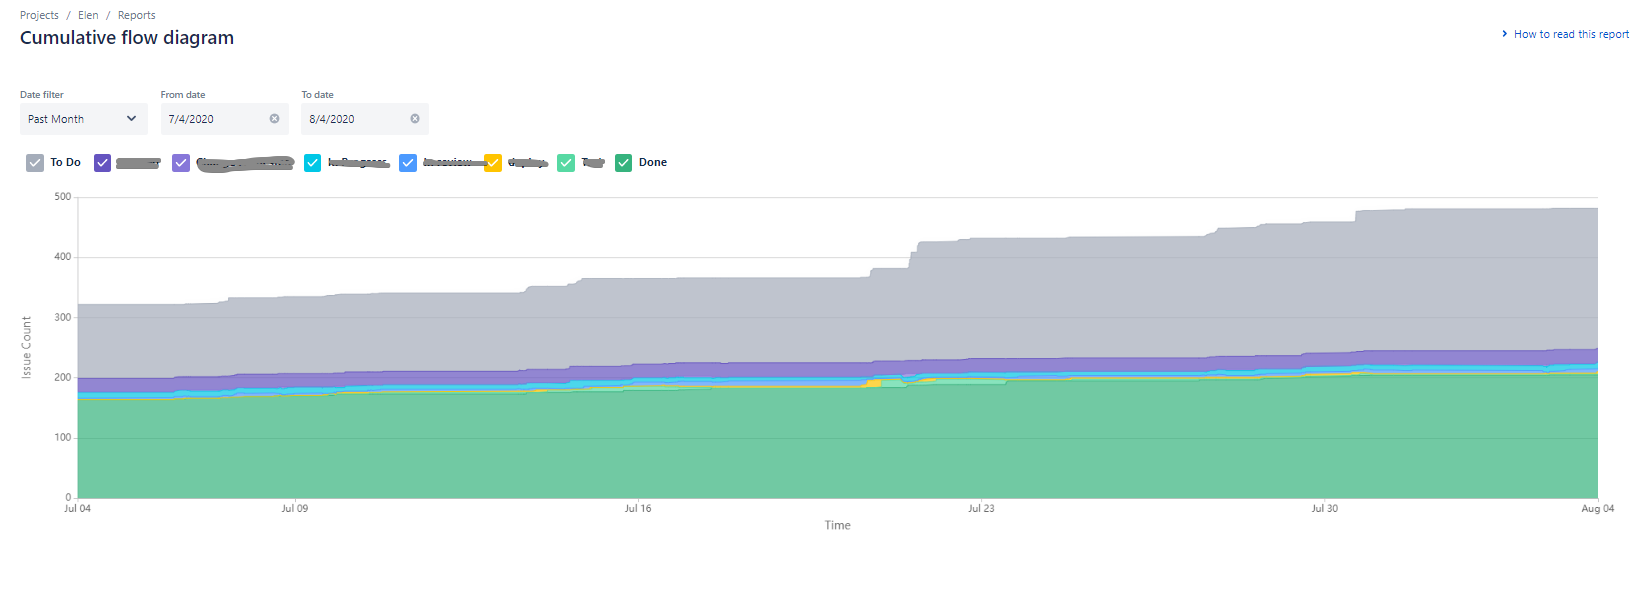
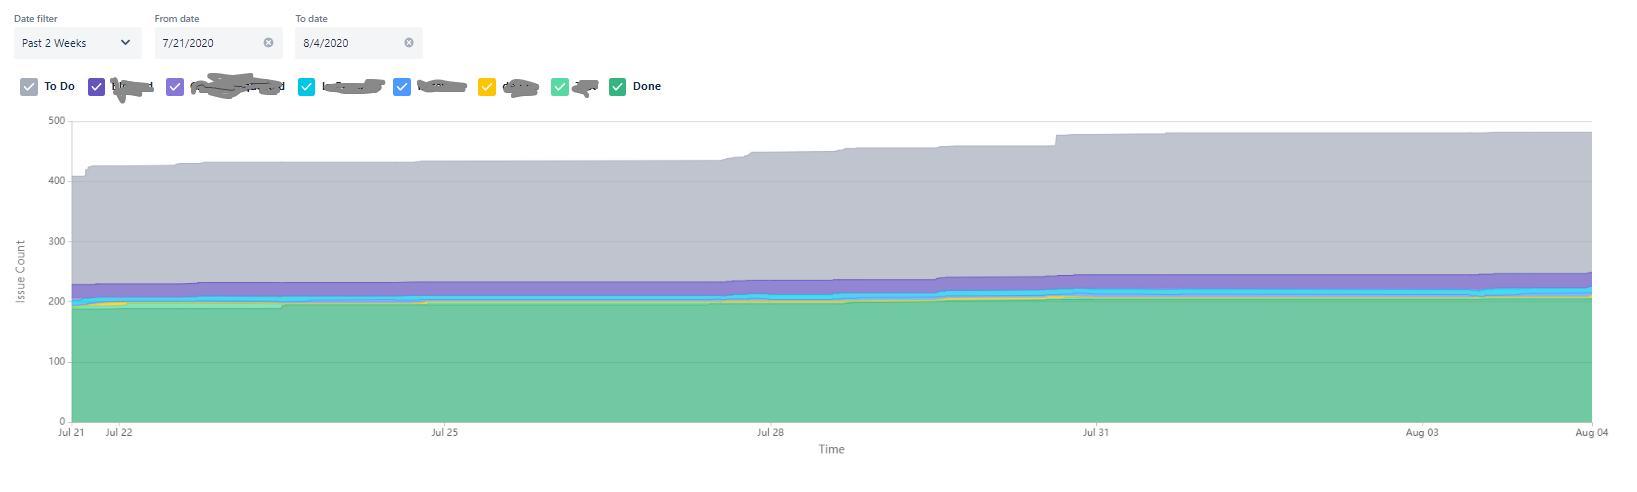
Hi, I'm trying to determine ways of improving our processes in the development cycles (sprints) and what are the issues we have. Reports are enabled on our next-gen project and I'm using Cumulative Flow Diagram, trying to find some peaks or something that could point me in the right direction. The issue is I am not sure how to read this diagram and it doesn't seem to show any kind of "movement". I tried filtering past 2 weeks, past month, past 3 months and it looks pretty much the same + the number of issues axis doesn't make sense cause we never have that many tickets in the sprints..
I have attached 2 screenshots of our reports and would appreciate any kind of advice.
The things I did notice so far is that the reports contains:
- Issues from the backlog, so not just from the board or the ones we worked in specific period..
- Issues that were completed long time ago, so not just from the period I chose for the report
- all statuses except ToDo and Done seem like nothing is happening or there is no progress whatsoever towards the end date
Am I doing something wrong and is there some other way for me to see/inspect our ways of working during the sprints?
I would like to see how often we fail on QA stage for example, so this would give me some insight..or how often a ticket is returned from code review to know if we have issues there perhaps..anything useful really..
Also, i am open to any other advise in the area of sprint-inspection and process improvements..but first I need to inspect in order to know what to improve 
Thank you,
Milica