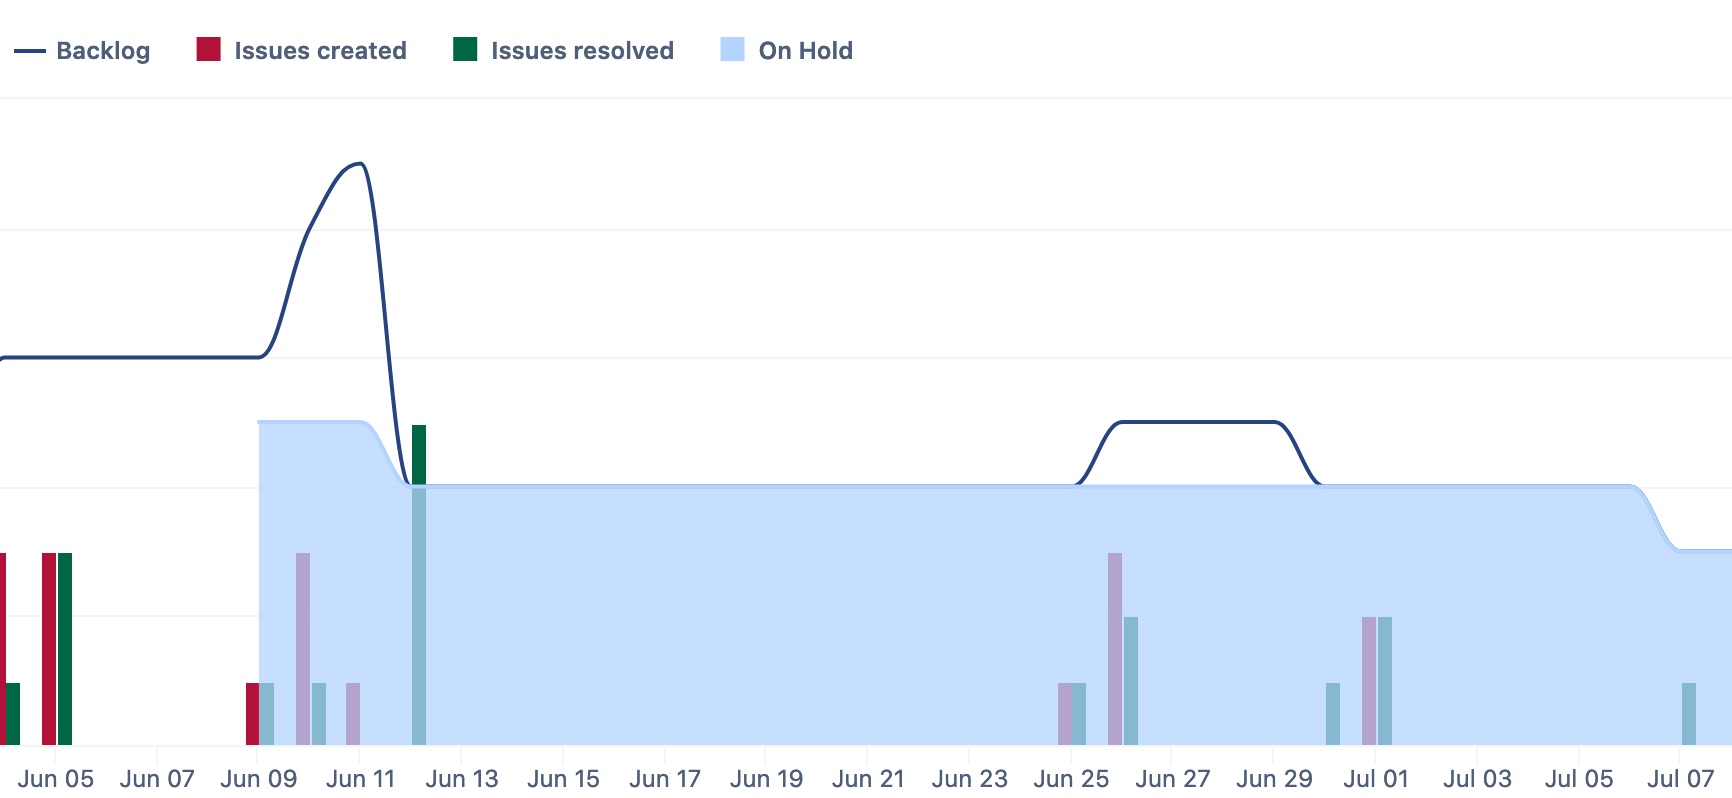
I've tried to create a report that would list issues opened, closed, and show backlog out of those, and now to add how many are in "On Hold" status. I've succeeded creating all but this last calculated value.
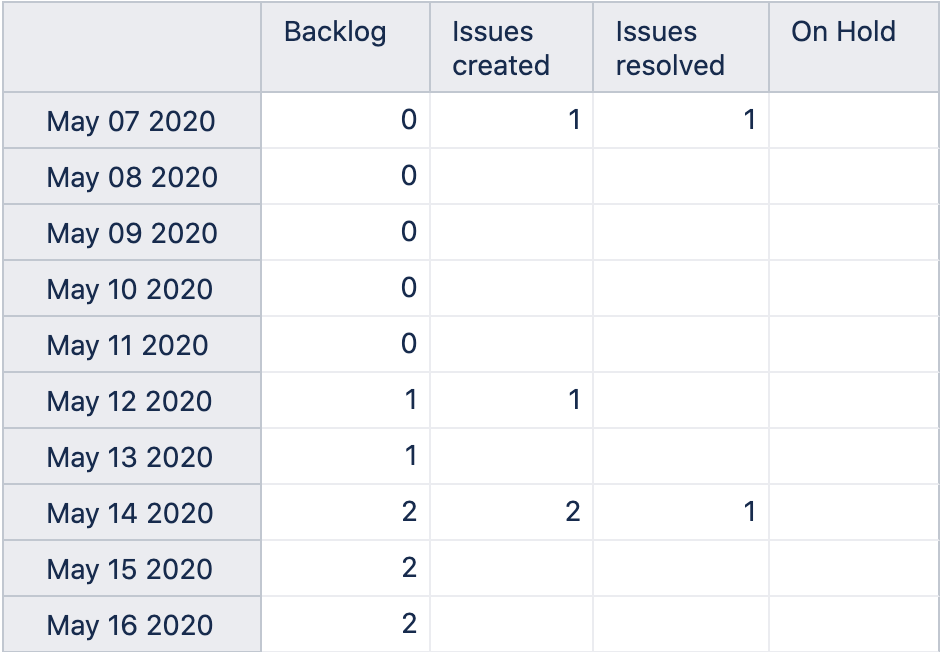
My data set does have the status history as a dimension and as a property.
Essentially I would want this On Hold measure to look for the day of the row, and look how many issues were on hold on that specific day.
EDIT:
To follow up, I did reach out to EazyBI support and got an answer from them, that solved the problem.
Having those status history as dimension and so forth is a prerequisite, then use Transition Status dimension together with measure Issue history. That will retrieve you the historical status of the issues for each Time period, use this tuple in Measure dimension to create a calculated measure:
(
  [Measures].[Issues history],
  [Transition Status].[On Hold]
)
This is how my timeline chart looks now: