Hi,
I'm trying to create a bar graph in Confluence that displays real time Jira data from a number of Jira filters.
To do this I've created a table, in the table I've added a Jira macro with JQL returning the number of issues.
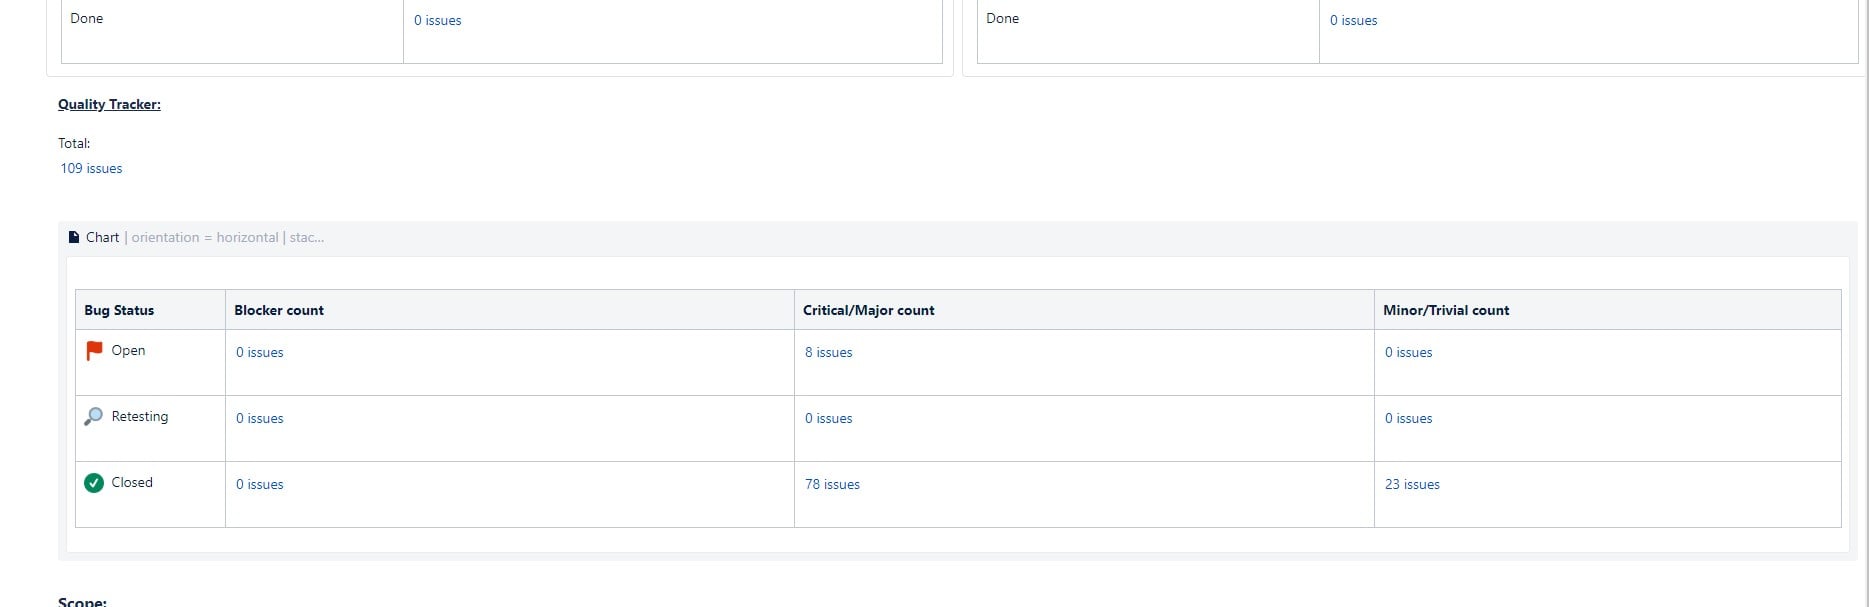
I've inserted this table into a Chart macro and can see the expected data in the edit preview. However when I publish the page the chart doesnt load.
This is being tried in Confluence Cloud, using new editing pages.
Has anyone tried this and succeeded?
Published page
Edit page
Edit Preview in Chart macro, showing the expected chart when published. 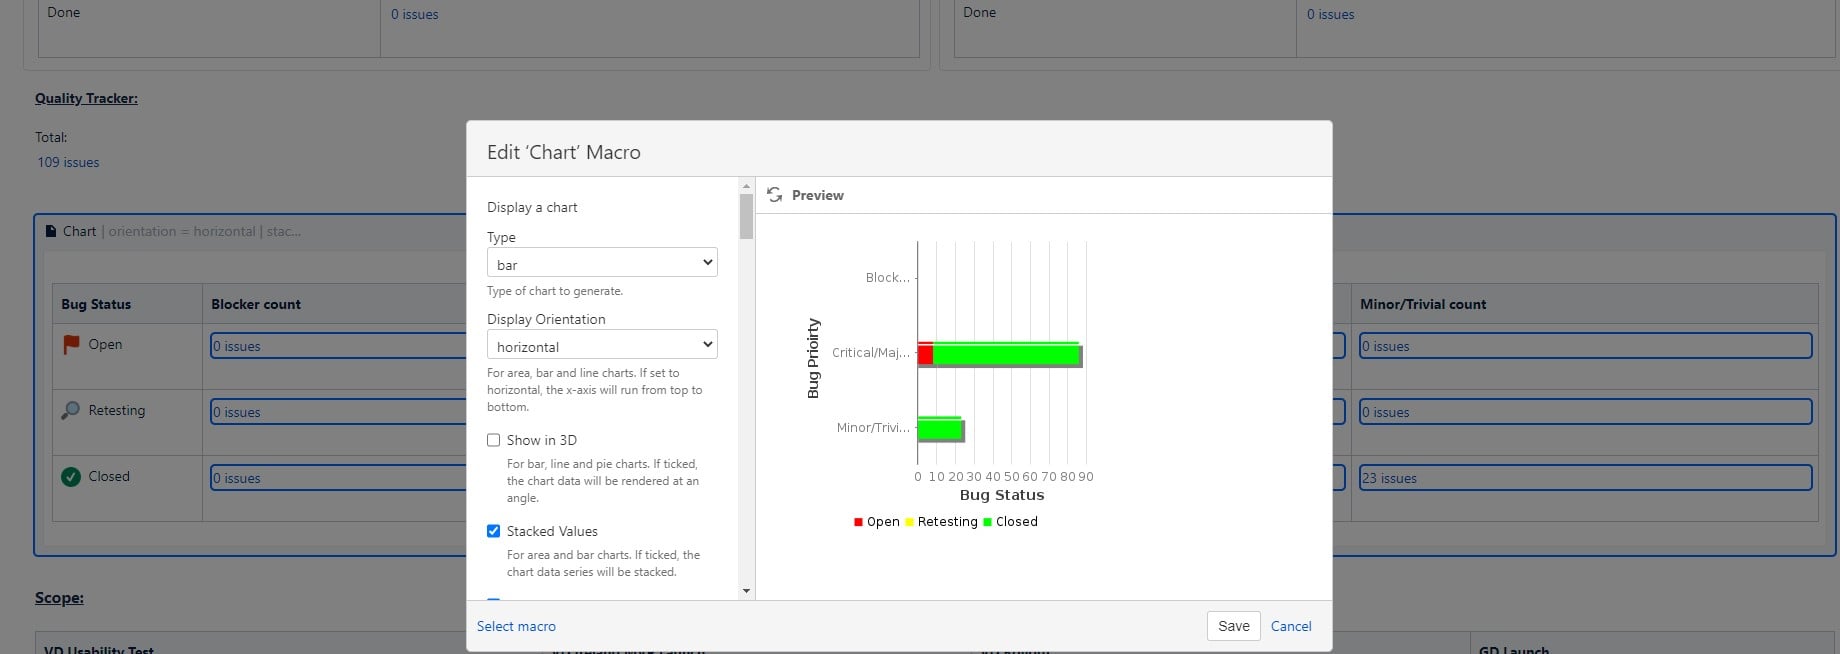
Thanks
T

