When editing the burndown chart in the reports section I'm able to adjust the Y axis to show 1) Story points estimate 2) Original time estimate 3) Story points remaining 4) Issue count. We use story points remaining at daily stand ups. 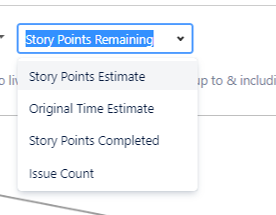
When looking to use the burndown chart as a gadget on a dashboard I'm unable to change the y axis with it being set on the story point estimate. Yes the tool is there in reports to access however this cannot be reviewed realtime along other key sprint gadgets. Any recommendations to adjust the view?


