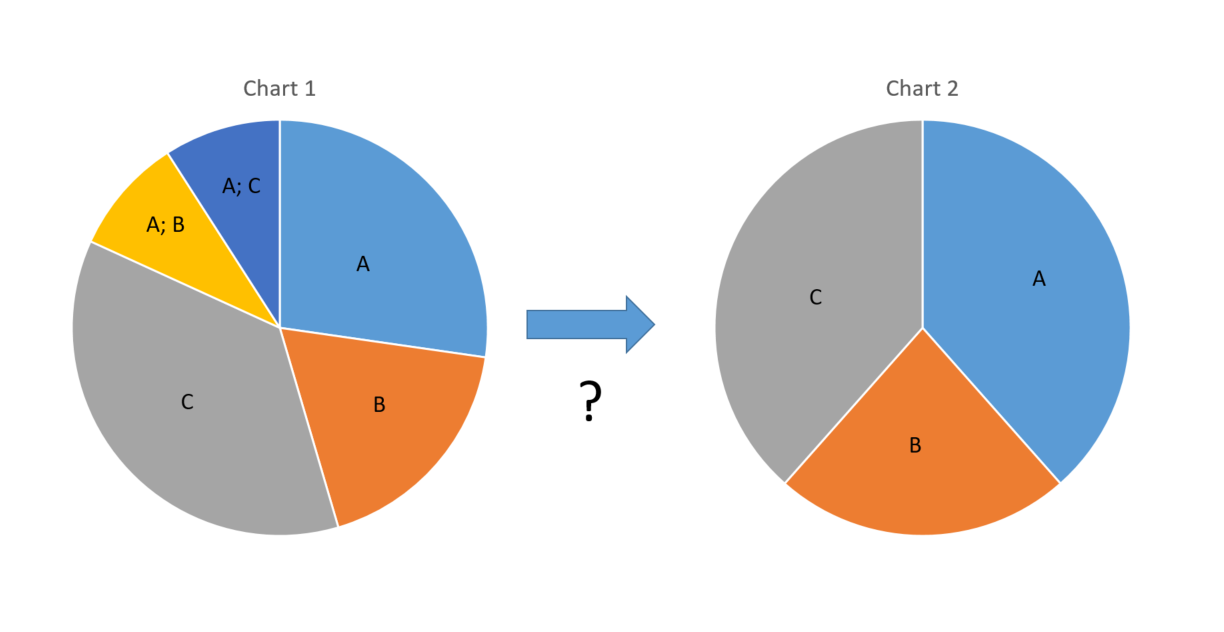
I have a checkbox group within a form that allows users to select one or more options. The form is then automatically plotted in a pie chart. When a user selects multiple checkboxes, confluence plots the entry as a new data point (chart 1 below). I would like the chart to count only the boxes checked (chart 2 below).
For example, if a user selects A and B from the checkbox group, I would like 1 count for A and 1 count for B, instead of 1 count for A; B.