Hello,
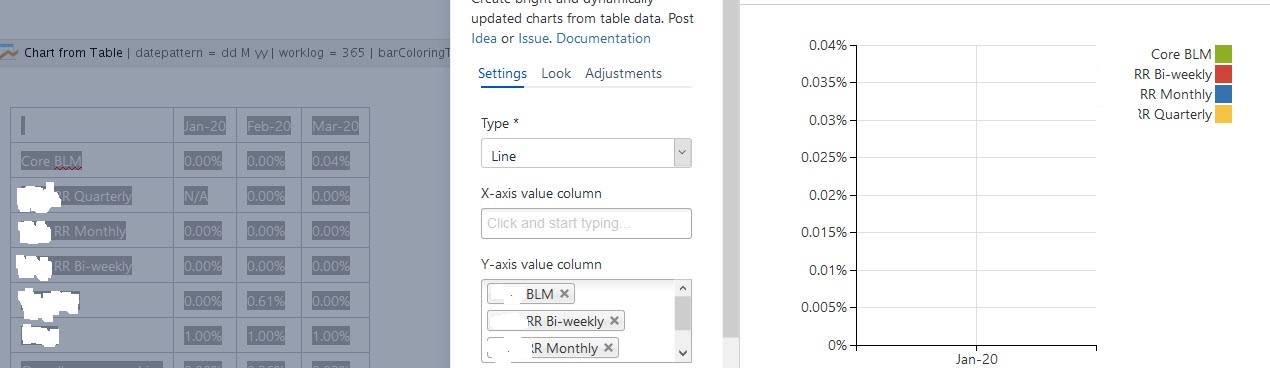
I am creating a chart from table and am trying to use the Line type visualization for the mentioned fields. I have adjusted the reading of the data to be Horizontal for my values, but the chart wont recognize my columns and is reading just the first one - Jan-20. When i tried with different visualization method- Column then it reads all my columns. Your help will be appreciated.
Thank you,
Kalin