I'm looking to make a chart or list of some kind (not sure if it's a dashboard thing, a report or otherwise - open to suggestions) for displaying the status of issues within a component.
I would like to display in a big list, all components, each row would have the component name, number of issues completed, total number of issues, and a progress bar that displays complete vs incomplete.
This is similar to how Epics are displayed in the backlog, where you have a list of them that each have a progress bar representing complete vs incomplete issues.
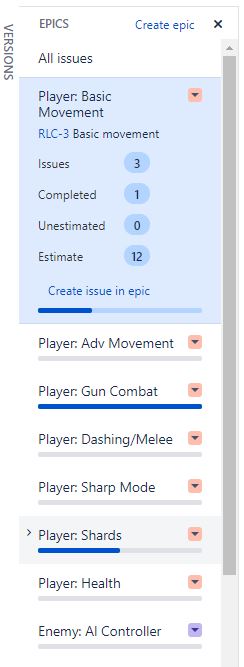
Of note is that originally we were going to use Epics for this purpose but we discovered that using them this way interfered with the BitBucket source control workflow which is of course more important.
The reason for wanting this is so that at a glance I can see which components of the project are falling behind or are otherwise done.
For context: we use Jira to manage our game development project, the Epics are being used by source control to manage implementable features that are intended to be completed, what I am aiming to use Components for is to document which 'Feature' of the project the task belongs to - for example:
Base Player Movement would be an Epic, since at some point that will be implemented and complete, later down the line a new Epic might be created called Refined Player Movement that deals with that code, but it's a different Epic.
Where as Player Movement System is a component that exists in the entire project, that multiple Epics and their linked issues can feed back into.
I have been able to get a dashboard two axis table working, but the components are out of order and the status' are also not in order, which makes it a pain to understand at a glance.
I'd appreciate any help figuring out a solution, thanks


