Hi,
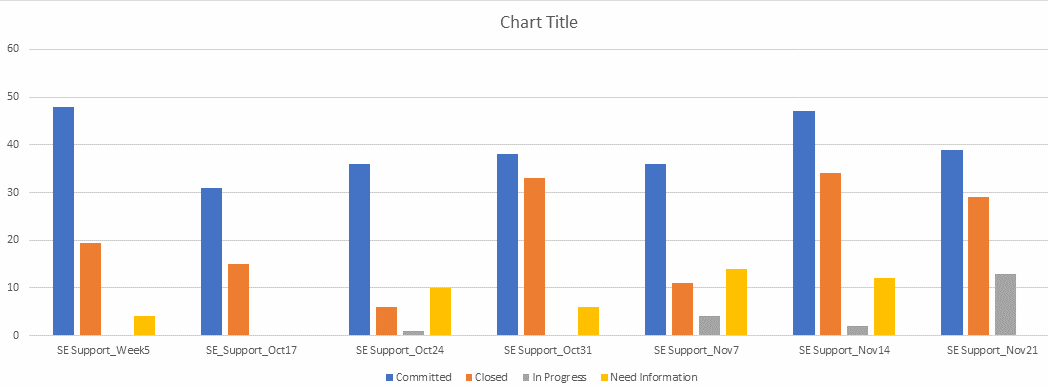
I am trying to put together a gadget/bar graph that shows committed story points Vs ticket statuses (Open; In progress; on hold; closed etc) in a sprint or multiple sprints together.
For ex :
I would like see a chart for lets say two months worth sprints (say 7)
So i am expecting to see something like below. FYI, this is a manually created chart.