Hi,
I'm using the standard chart macro from Confluence to display time series data in a line diagram. I use the type timeSeries for the chart macro. In the first column of the input table, the timestamp is given in the format "dd.MM.yy HH:mm" and in the second column, the number of assets are given.
Despite there is no timestamp twice in the table, I get the following error:
"You are attempting to add an observation for the time period Thu Nov 07 00:00:00 UTC 2019 but the series already contains an observation for that time period. Duplicates are not permitted. Try using the addOrUpdate() method."
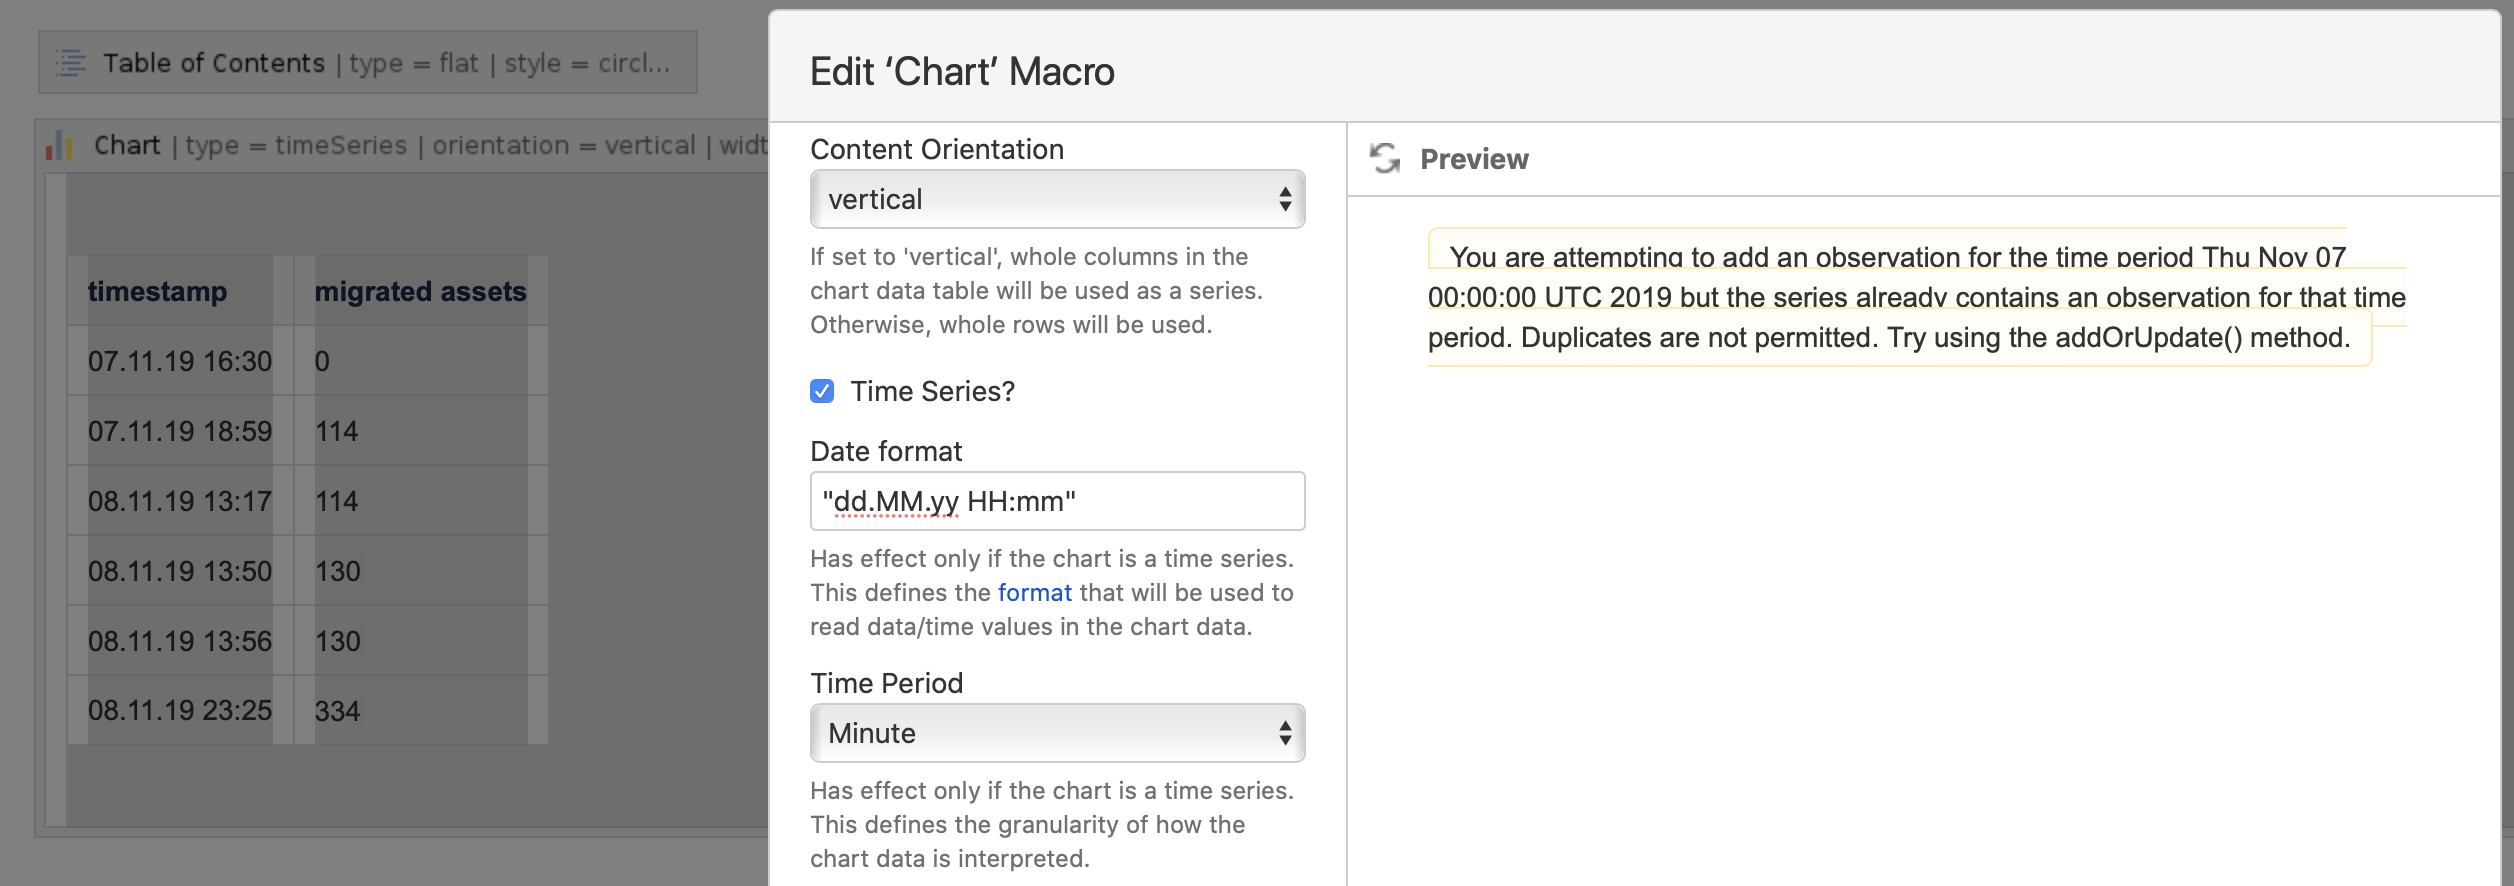
Somehow, the macro cannot read the hours and minutes despite the date/time format should be ok.
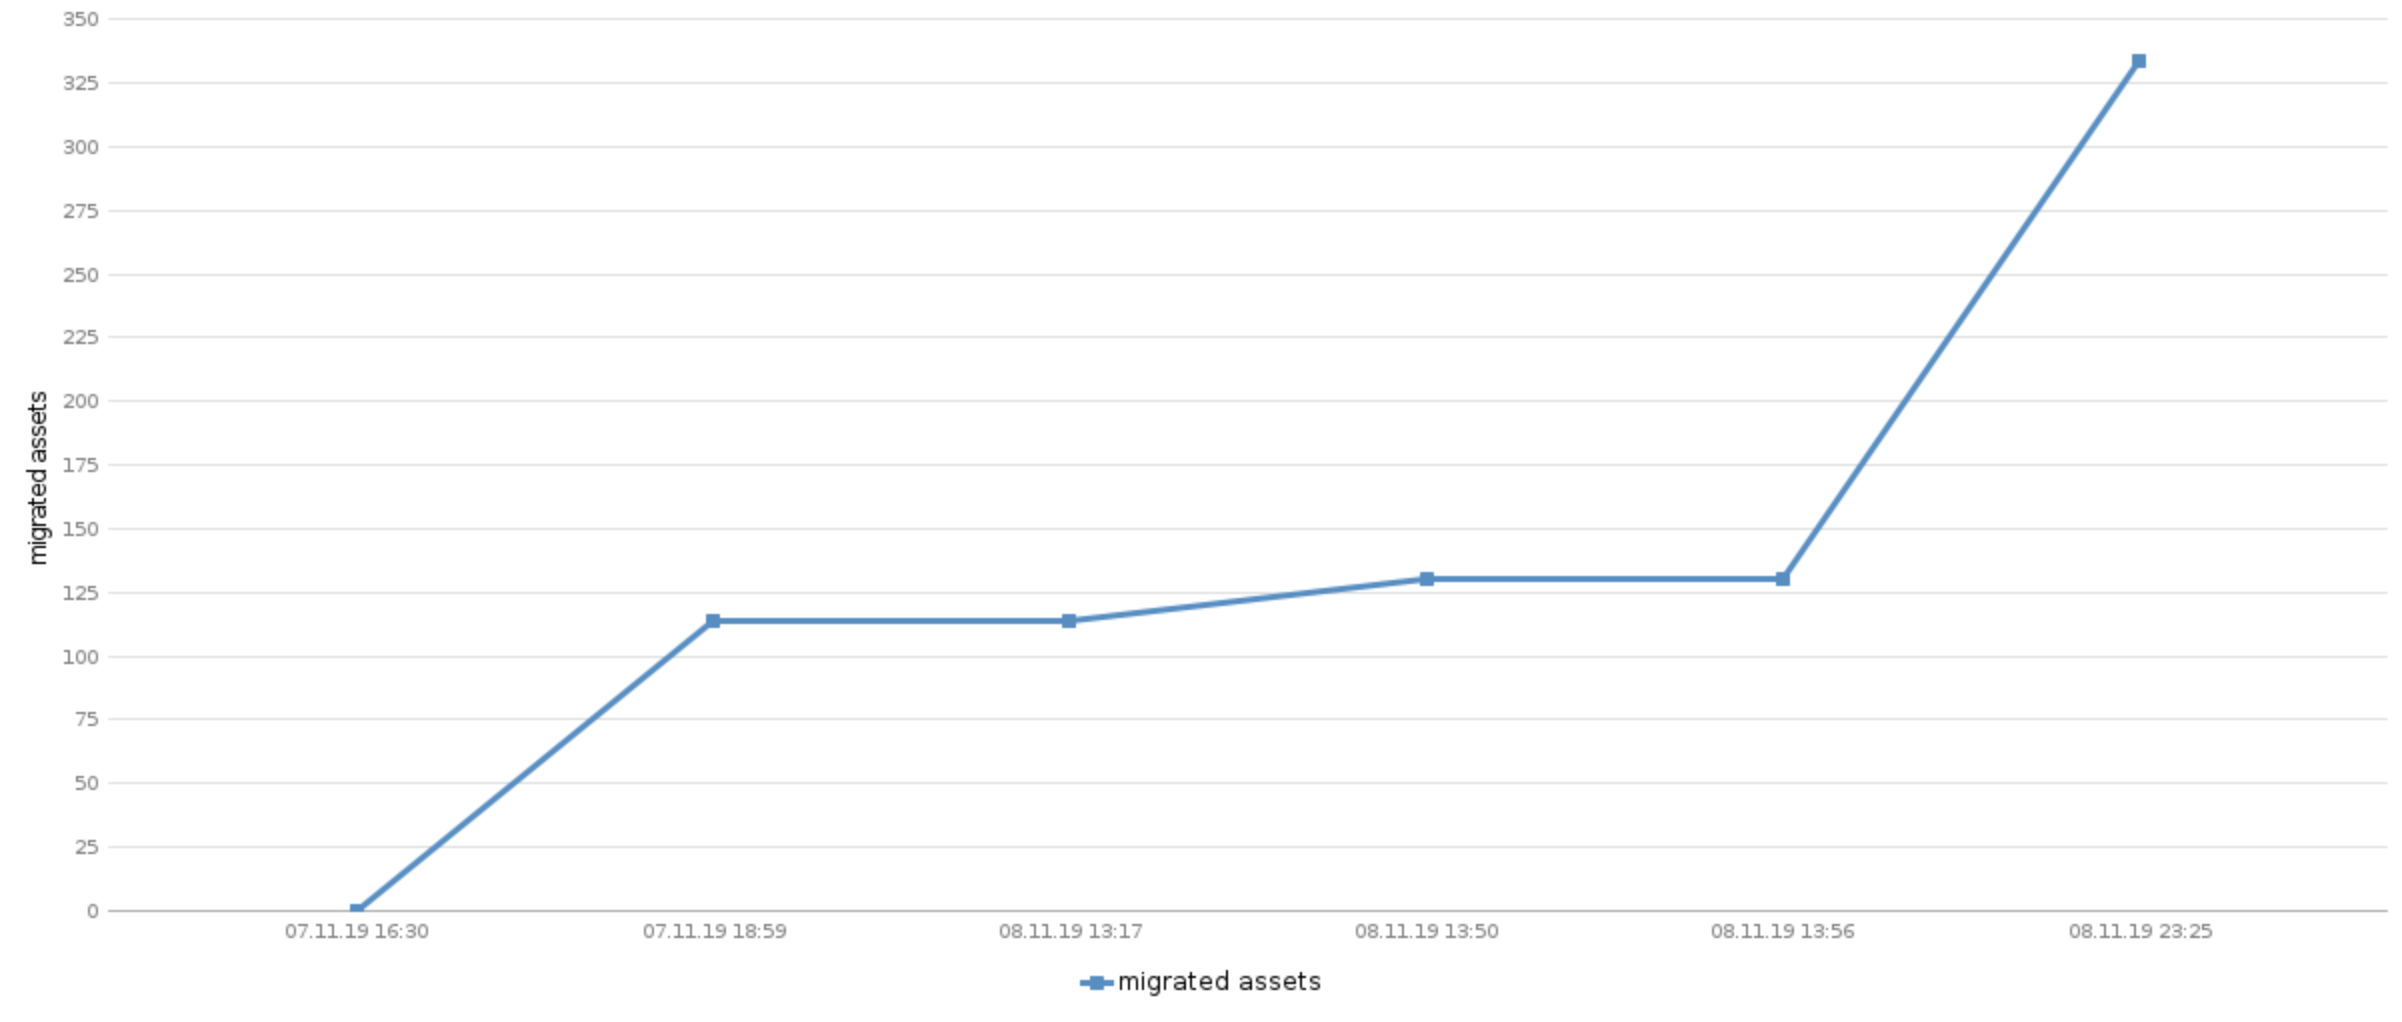
The result should look similar to the following chart but as time series chart with correct gaps between the data points.
Any idea?


