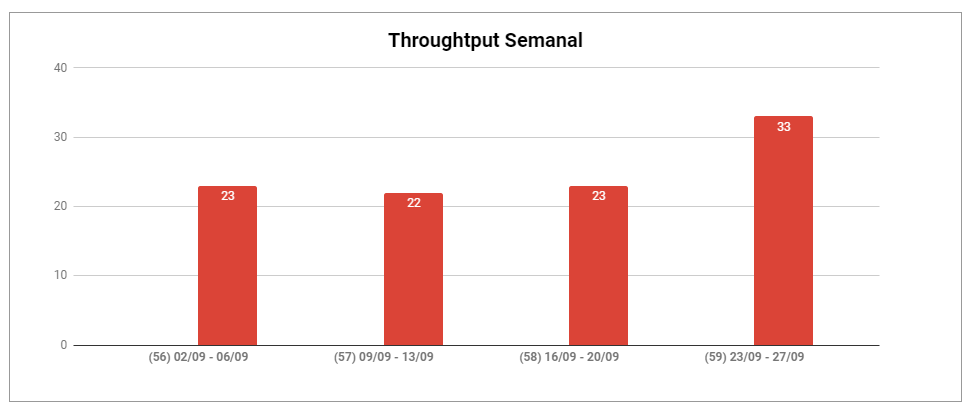
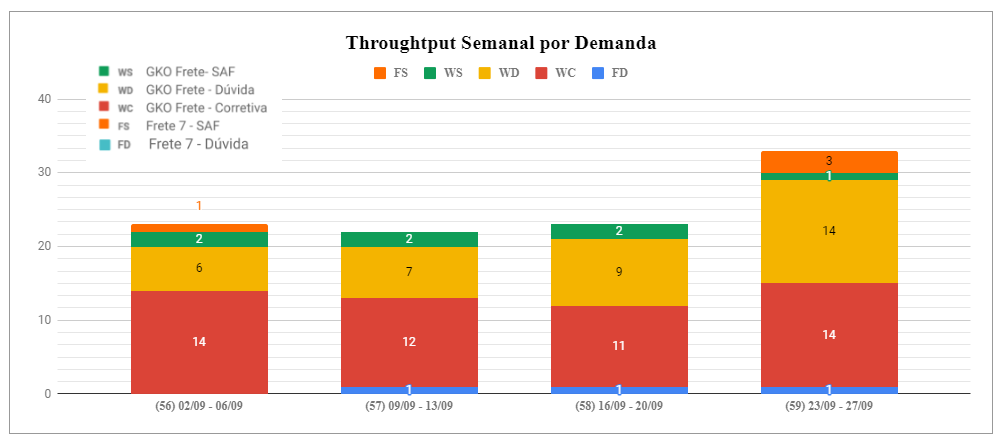
I need to create simple bar charts in jira, but I need to use custom fields to create them, one of them is a text field and the other a combobox, but only brings me the date field option, the graph is generated incorrectly and error occurs when you click on it.
I have the graphics in excel, below them, I need to create these graphics this way in Jira software, how can I assemble? It's possible?