I am new to JIRA Cumulative Flow Diagrams and have reached a hurdle I can't seem to understand.
All the documentation I can find states there is something wrong with your diagram if you see "bands going down", and that somehow the diagram has not been constructed properly
This is a snapshot from our current CFD:
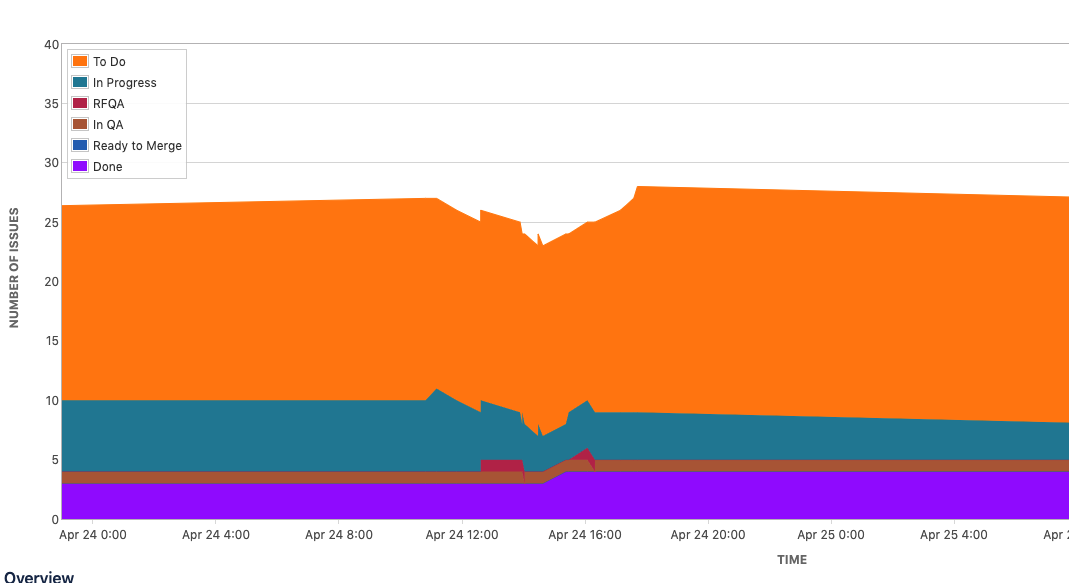
Can anyone help me understand what I need to look for to understand the downward bands in the above?

