Using Advanced Label Manager for Jira, users can not only manage labels but also analyze and visualize their usage with its powerful reporting capabilities. By integrating seamlessly with Jira Dashboard, this feature enables teams to create customized label reports that provide valuable insights into their workflow.
Overview of Advanced Label Manager for Jira
Advanced Label Manager offers a complete solution that enables you to use labels in Jira with ease and confidence. The newly added reporting capabilities allow teams to visualize label data directly within their existing Jira dashboard, eliminating the need for external reporting tools.
Key Use Cases for Label Reporting
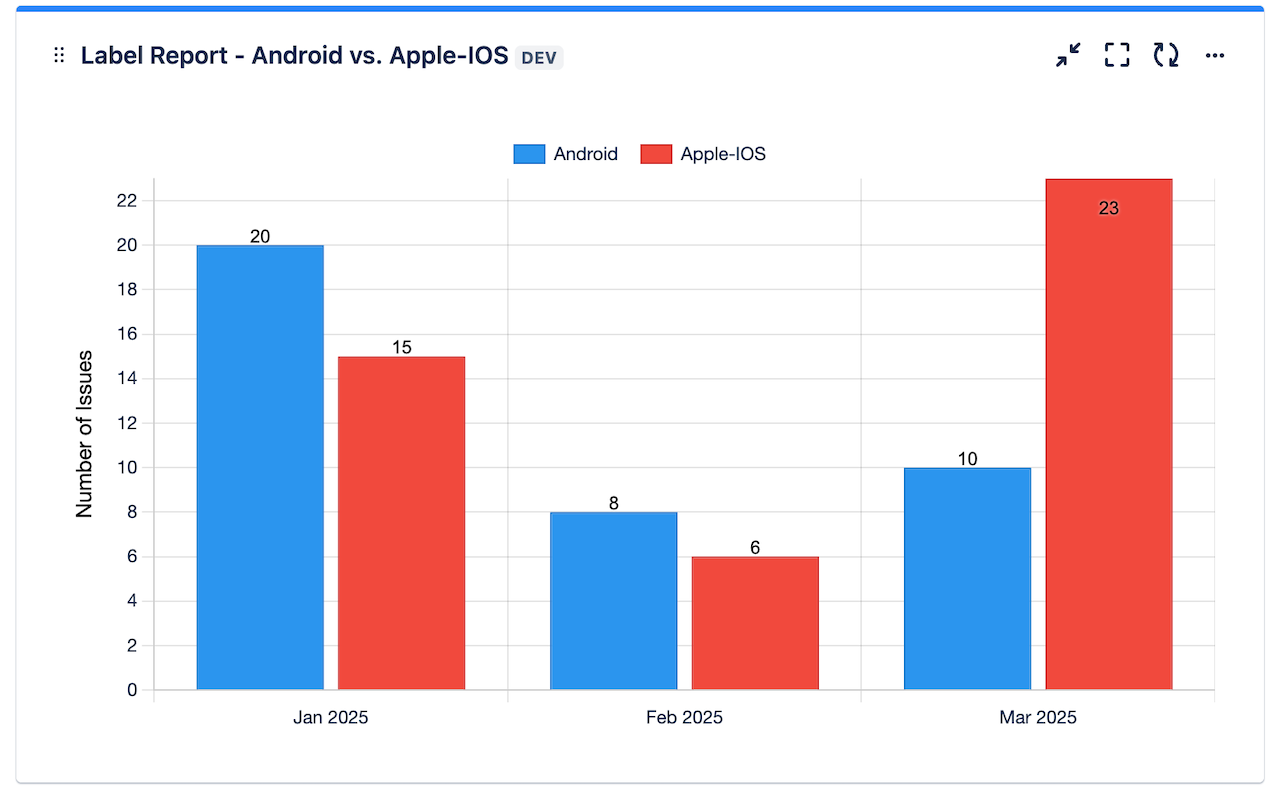
1. Tracking Issues with Specific Labels Over Time
One of the most valuable features of label reporting is the ability to monitor how specific labels are used across projects over time. This time-based analysis helps teams:
- Identify trends in issue creation and resolution
- Monitor the frequency of certain types of issues
- Track project progress through label usage patterns
2. Comprehensive Label View
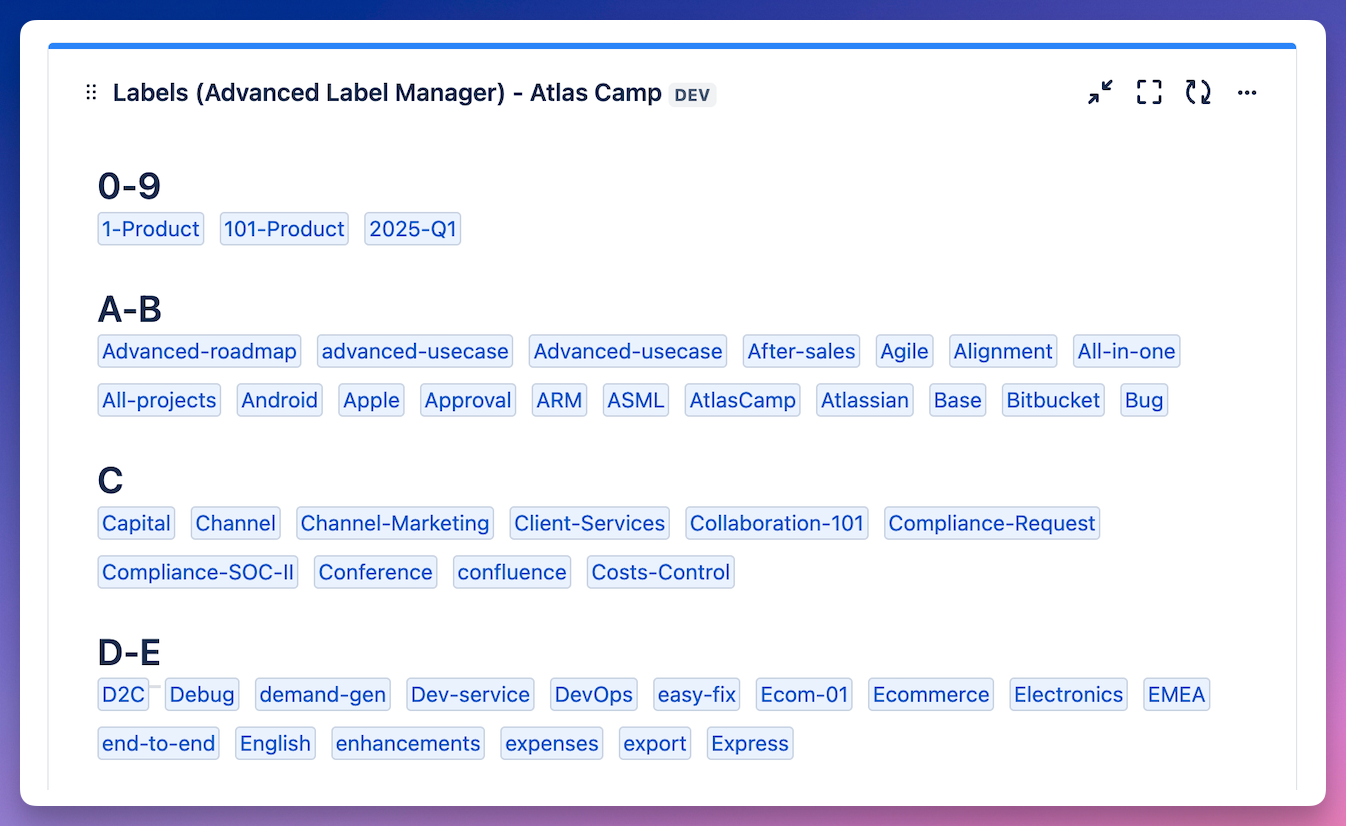
The label dashboard provides a centralized view of all labels within your Jira instance. This comprehensive overview offers:
- Quick access to labels from a project or saved filter in dashboard
- Real-time updates on label usage across projects
This feature is also replacement for Labels Gadget that is now deprecated and will be soon removed from Jira.
3. Visualizing Work Distribution with Pie Charts
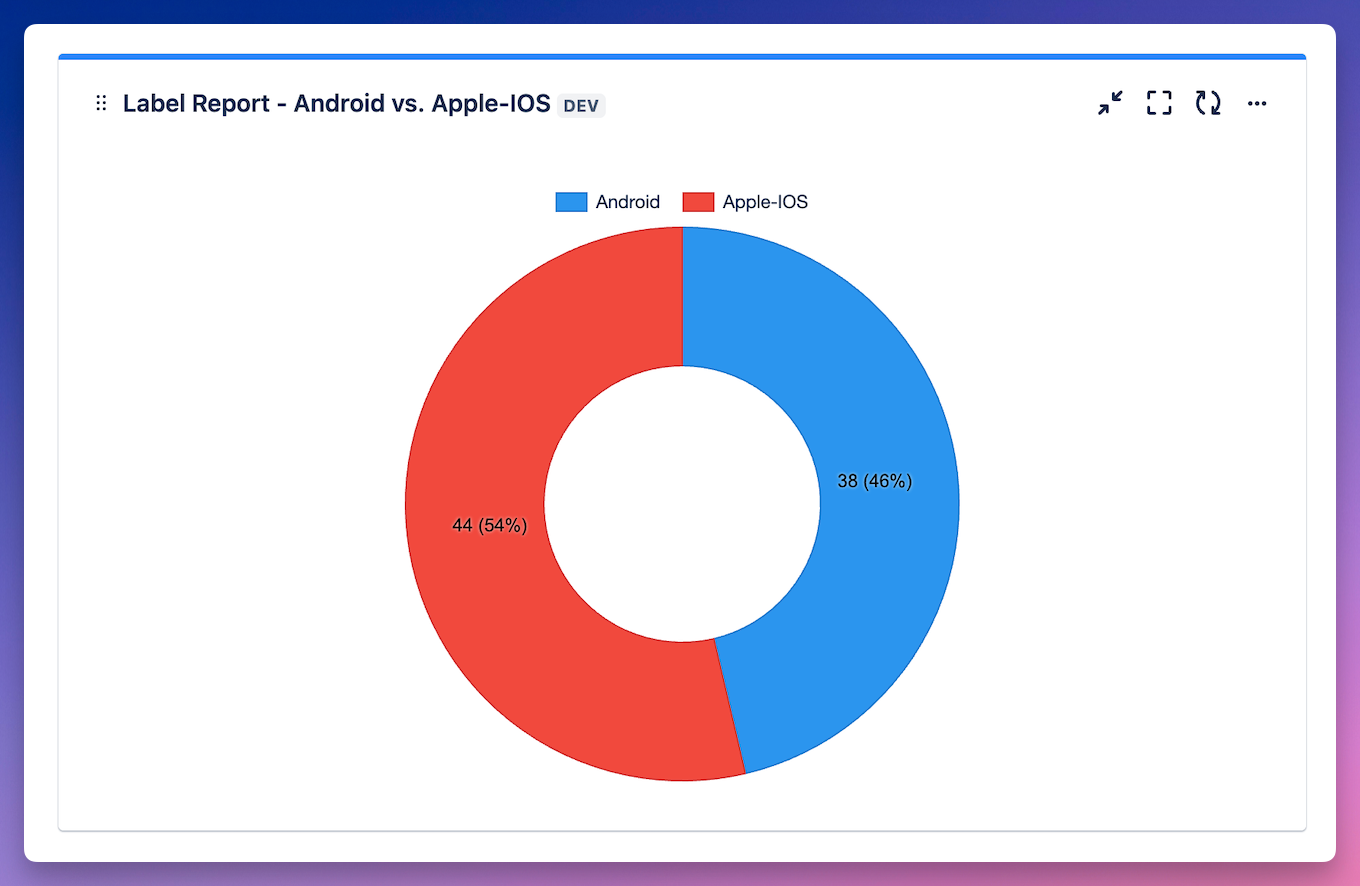
The pie chart feature transforms label and issue data into clear, visual representations of work distribution. Users can:
- Filter out unwanted labels to focus on relevant data
- Track issue or work allocation across different categories
- Visualize and compare the proportion of issues by label used
Conclusion
Label reporting in Jira, powered by Advanced Label Manager, provides teams with powerful tools to analyze, visualize, and optimize their label usage. By implementing these reporting capabilities, organizations can make more informed decisions about their project management processes and improve their overall workflow efficiency.
If you haven't used the app yet:
How do you use labels in Jira? Let us know in comments below 💙

