Managing multiple projects is never easy.
You need a clear view of the big picture across projects and teams to make sure everything’s on track and delivered on time. Plus, this view is usually what you’ll share with top management and external stakeholders.
But how do you actually do that? And is it possible to stay in Jira without having to go back and forth between Excel and PowerPoint?
Good news – yes, you can!
Let’s take a look at how.
How to set up a native Jira dashboard for multiple projects?
A native Jira dashboard can gather Jira data points from underlying projects and display important key metrics in one place. A new dashboard can help project managers, Scrum Masters, and the entire team monitor delivery without opening every project individually.
For example, project managers can use dashboards to track:
To create a dashboard:
-
Navigate to Dashboards from the Dashboards dropdown in the left sidebar and select Create Dashboard.
-
Give it a clear name and save.
-
Click the Add Gadget button and choose the gadget that fits your needs.
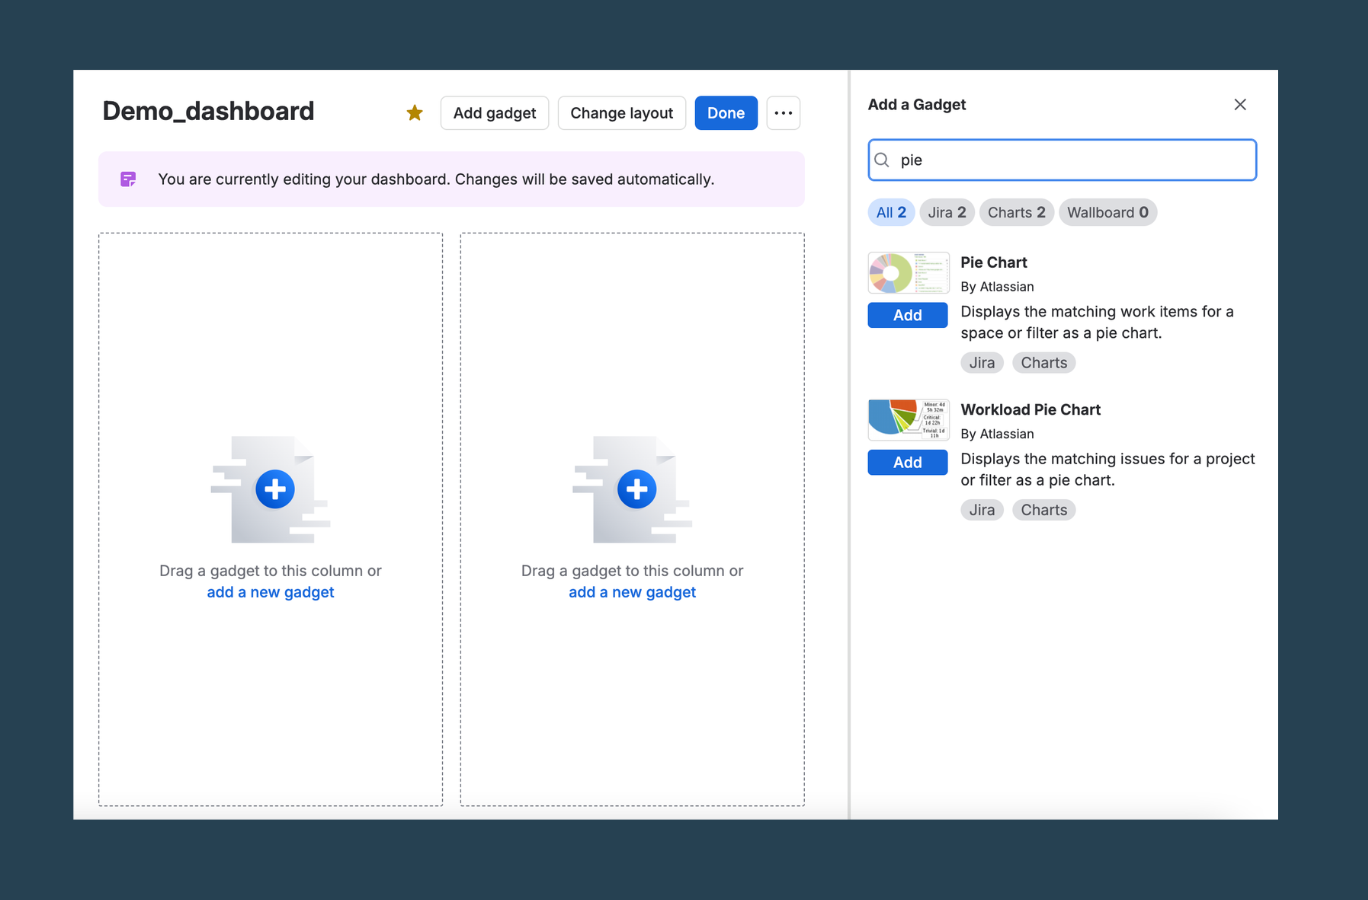
Popular native Jira dashboard gadgets include:
These native gadgets let you visualize project issues in different ways. For example, the Pie Chart gadget can display issue types or priorities, while bar charts available through other gadgets help compare work across projects.
Use an Advanced Search filter to make sure your gadget displays data from more than one project.
In the query bar, use JQL with the project in operator followed by your project names:
project in ("Project A", "Project B", "Marketing Launch")
Save the filter, select it within your gadget settings, and your dashboard will populate with the data from all selected projects.
You can also customize the layout by choosing your preferred layout, arrange gadgets on a single screen, and configure sharing dashboards permissions so other users can access them. Depending on your permission schemes, you can share Jira dashboards with specific team members, groups, or your whole Jira instance. On Jira Data Center, administrators have additional options for dashboard sharing and visibility.
A well-designed dashboard provides actionable insights that help teams identify risks, monitor progress, and resolve customer requests faster.
Common dashboard mistakes
Not every dashboard is a good Jira dashboard.
A bad dashboard often contains too many gadgets, duplicated metrics, or bad charts that are difficult to interpret. Trying to fit every available report onto one page usually creates noise instead of clarity.
Instead, focus on a few useful gadgets that answer your most important questions. Remove or drop gadgets that don't provide value, and avoid relying on the default option if it doesn't match your reporting needs. If you need more context, let the gadgets link back to the underlying issues instead of trying to display every detail.
Remember that some gadgets only show the data available to the logged in user. In some cases, they'll display only the data that user has permission to access, while anonymous users may not see any information at all if permissions restrict access.
Limitations of native Jira dashboards
A native dashboard is a static snapshot, not a plan. It shows you what is happening (for example, how many bugs are open, how many Jira issues are completed, how many story points remain, or how work is distributed). But it does not show how work evolves over time.
Although dashboards can display information from custom fields, they're still designed primarily for reporting rather than planning.
With native dashboards, you cannot:
☹️ drag and drop issues to adjust your plan
☹️ easily visualize cross-project dependencies
☹️ see how project timelines overlap
☹️ manage team workload across multiple projects
☹️ plan resources and capacity
Dashboards are useful for reporting, but they are not enough for managing complex projects.
To truly manage multiple projects, you need a roadmap, not just a report.
How to create a Jira roadmap for multiple projects
For teams managing multiple Jira projects, a visual roadmap provides a more complete picture.
Planyway is a visual planning tool that works directly inside Jira Cloud and syncs your Jira data automatically.
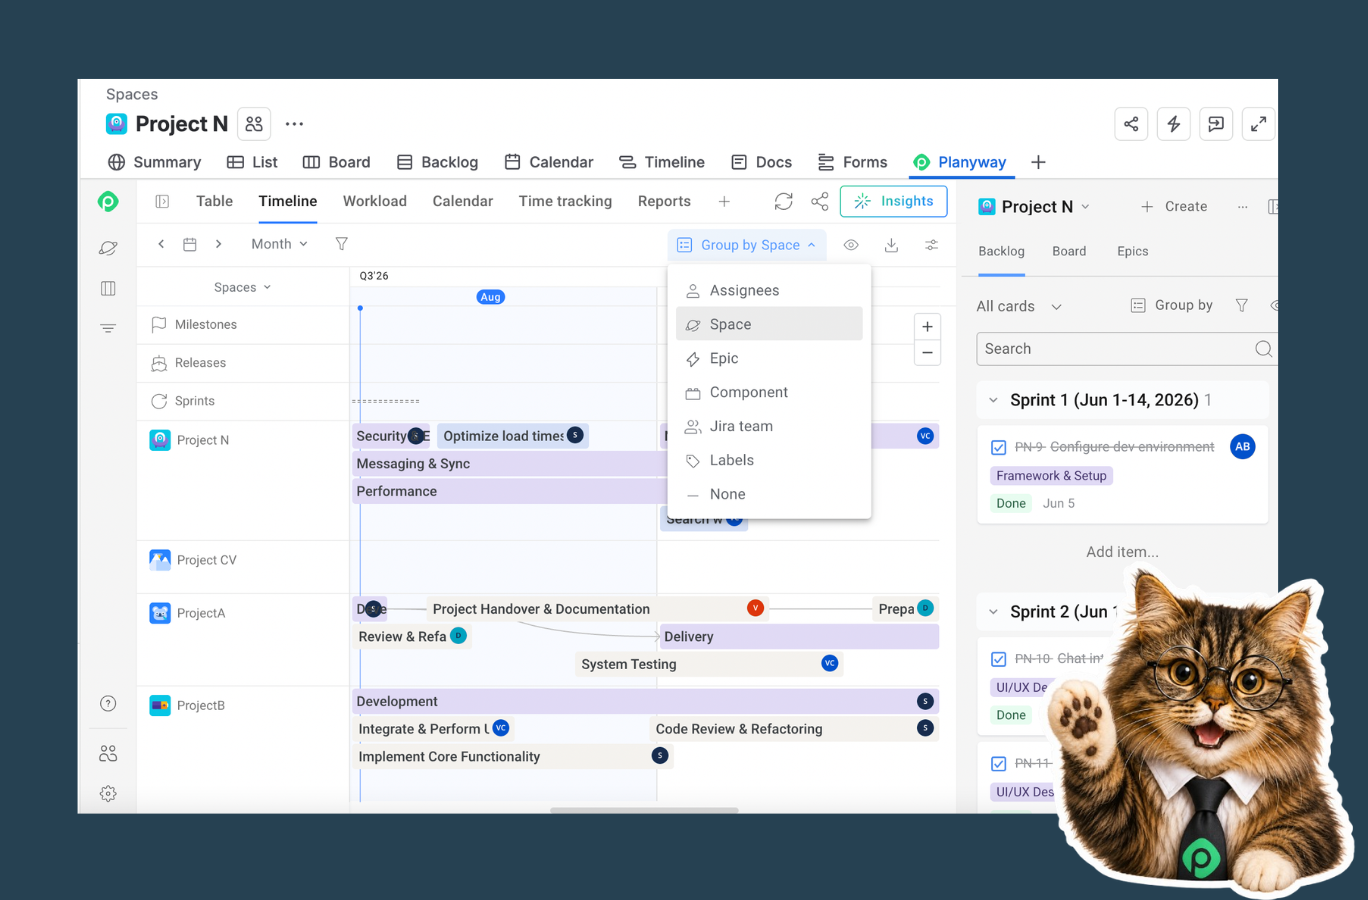
Instead of switching between Jira reports, spreadsheets, presentations, and Confluence pages, you get a unified timeline where you can plan work, track progress, and manage dependencies.
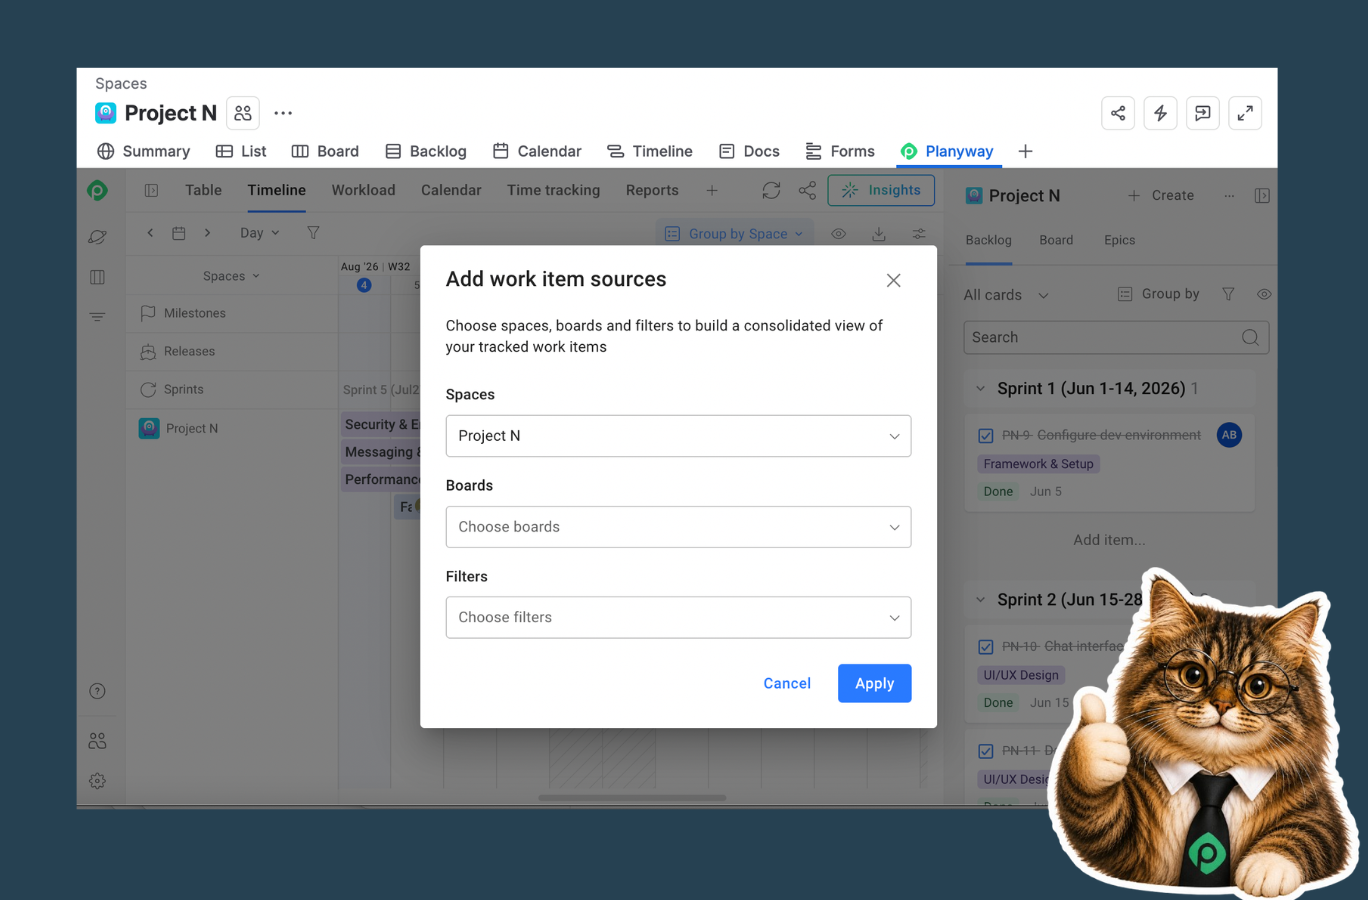
- Connect multiple sources (Spaces, Boards, JQL glitter results) and bring them all on the same roadmap.
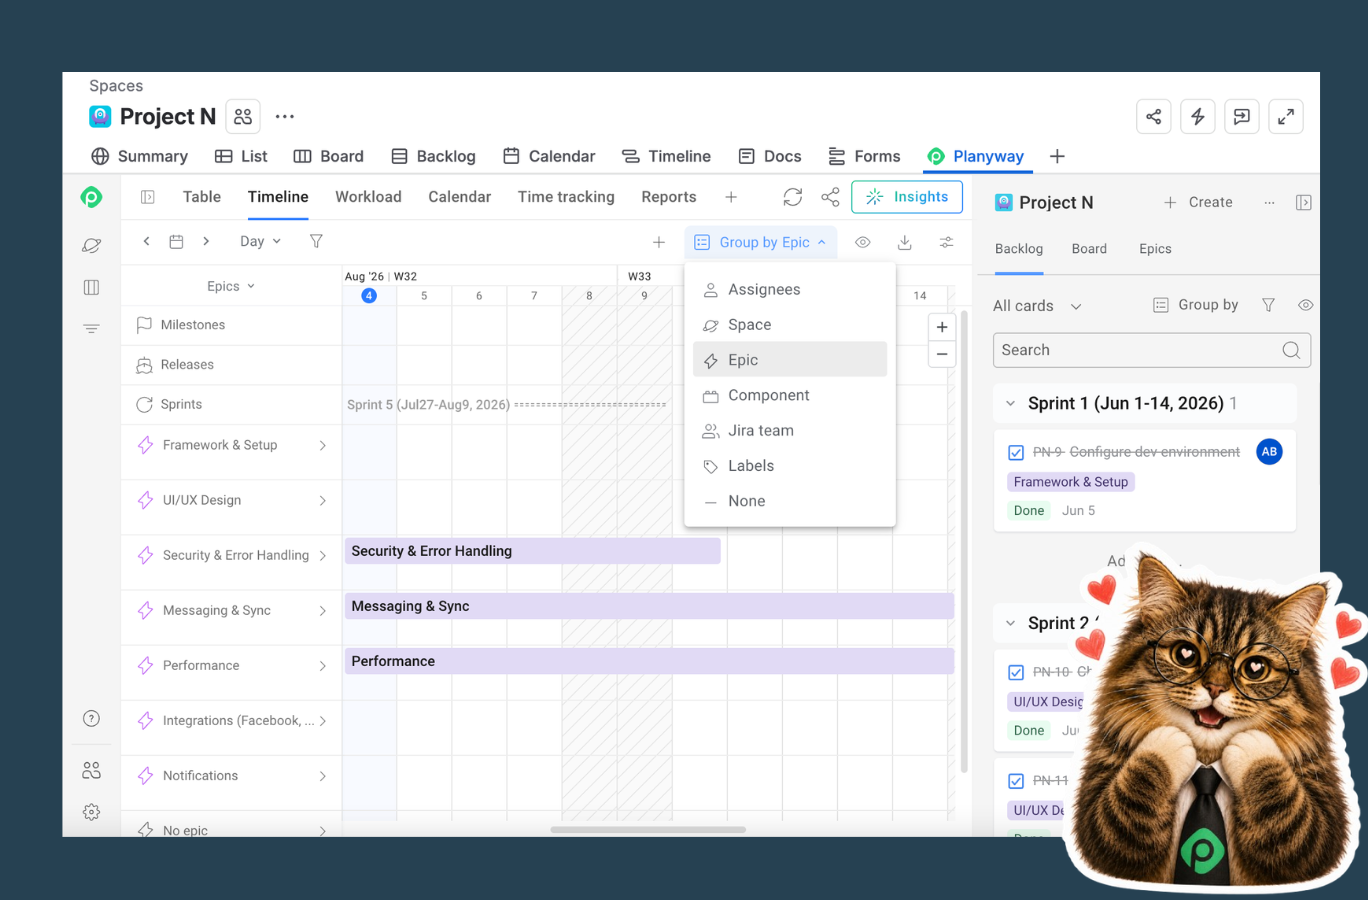
- You can stay high-level with epics and zoom into individual Jira issues when needed.
- Set up milestones to highlight important dates, deadlines, and key milestones. You can also make epic milestones visible to track major deliverables.
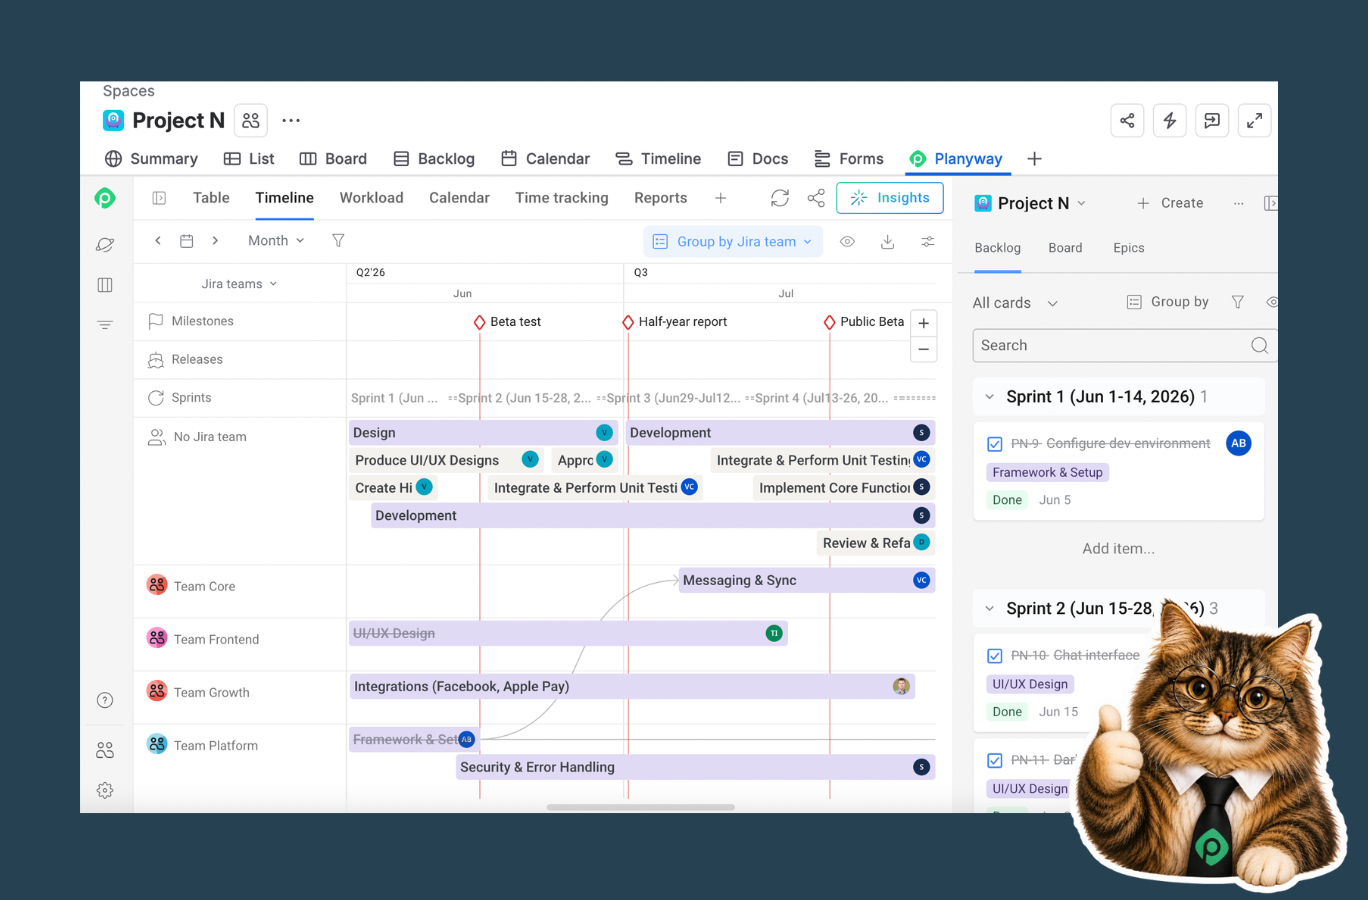
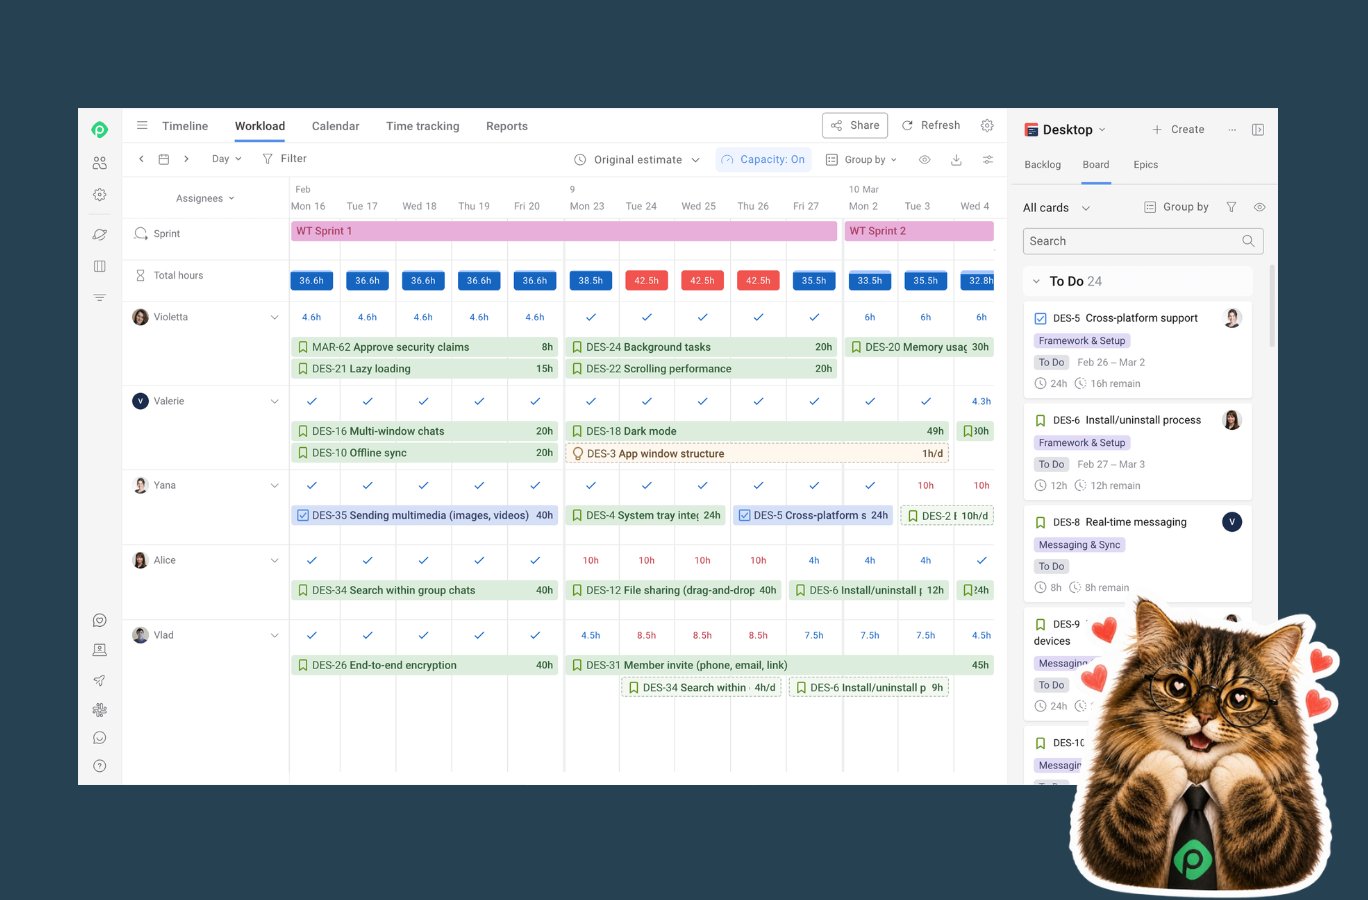
- Managing resources across projects is possible too. Just group your timeline by users while keeping multiple sources connected. If you switch to the Workload tab, you can even calculate capacity. Here is more about it.
- What if you manage multiple teams and want to see how work is distributed? Group the roadmap by teams and get exactly this!
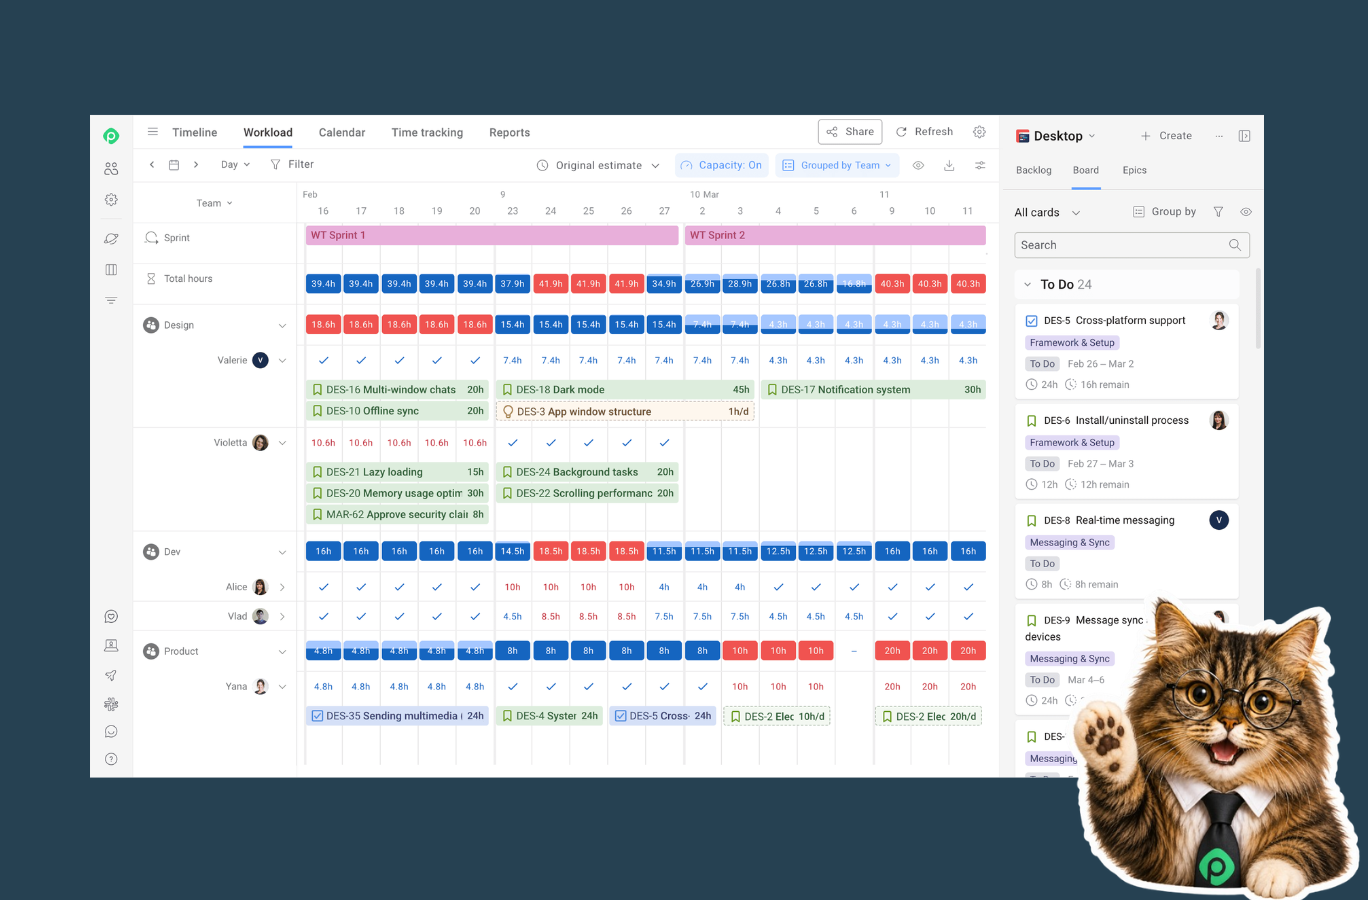
Unlike dashboards, our live roadmap lets you update plans with drag-and-drop scheduling while everyone sees the latest information without exporting reports or rebuilding presentations.
Native Jira dashboards are perfect for reporting. Planyway complements them by providing visual planning, scheduling, and resource management so teams can actually deliver work on time (and finally stop jumping between browser tabs trying to piece together the full picture).
