Community resources
Community resources
Community resources
- Community
- Products
- Atlassian Analytics
- Questions
- I am trying to configure a dashboard that shows epic cycle time
I am trying to configure a dashboard that shows epic cycle time

Hi
I am trying to create a dashboard that shows all our projects epic cycle time and have been pointed in the direction of Eazy Bi, but it's not that Easy for me. Then I saw the Flow metrics chart that could be added to a dashboard in this article. However, when I go to try and add it, there is no flow gadget for me to configure.
Please help, surely epic cycle time must be a common need across organisations to report?
Thanks
Jess
4 answers
Hello @Jess Painter ,
Cycle Time is a valuable metric for all teams but since Epic'a are also issues, their workflows can be customized so the exact definition of Cycle Time is not the same for each Jira (It even might not be the same for all Epic on a single Jira instance).
Let me recommend our app for flexible reporting on such needs. Our team at OBSS built Time in Status precisely for this. It is available for Jira Server, Cloud, and Data Center.
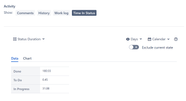
Time in Status mainly allows you to see how much time each issue spent on each status or each assignee.

You can combine the time for multiple statuses to get metrics like Issue Age, Cycle Time, Lead Time, Resolution Time etc.
For all numeric report types, you can calculate averages and sums of those durations grouped by the issue fields you select. For example total in-progress time per customer or average resolution time per sprint, week, month, issuetype, request type, etc. The ability to group by parts of dates (year, month, week, day, hour) or sprints is particularly useful here since it allows you to compare different time periods or see the trend.
The app calculates its reports using already existing Jira issue histories so when you install the app, you don't need to add anything to your issue workflows and you can get reports on your past issues as well. It supports both Company Managed and Team Managed projects for Jira Cloud.
Time in Status reports can be accessed through its own reporting page, dashboard gadgets, and issue view screen tabs. All these options can provide both calculated data tables and charts.


https://marketplace.atlassian.com/apps/1211756/
EmreT
Hi @Jess Painter : The flow metrics dashboard in the article you mentioned above is available as part of Atlassian Analytics. You would need to have Atlassian Analytics subscription in order to use that dashboard. It is not yet available as a gadget in Jira dashboards.
Thanks,
Inder
You must be a registered user to add a comment. If you've already registered, sign in. Otherwise, register and sign in.

as another addition to the already recommended solutions, I can refer you to our recent article, where we explain more about Flow reporting in Jira and give examples made by our app Custom Charts.

You must be a registered user to add a comment. If you've already registered, sign in. Otherwise, register and sign in.
I recommend you try Dashboard Hub for Jira - Custom Charts & Share Reports which is an app developed by my team :)
Among the large library of nearly 100 gadgets that it offers, you can find the Cycle Time gadget and the Epic Progress gadget – which I'm sure you'll love.
If there's a metric that you can't find in our library, you can create it yourself with the JQL Custom Charts gadget!
In addition to that, Dashboard Hub for Jira provides pre-defined dashboard templates, Formula Cards, 12+ product integrations, external sharing with protected links, and much more. Find the use cases here.
Feel free to try the app for 30 days without any compromise, don't hesitate to ask me if there's anything I can help with :)
You must be a registered user to add a comment. If you've already registered, sign in. Otherwise, register and sign in.

Was this helpful?
Thanks!
- FAQ
- Community Guidelines
- About
- Privacy policy
- Notice at Collection
- Terms of use
- © 2025 Atlassian


You must be a registered user to add a comment. If you've already registered, sign in. Otherwise, register and sign in.