Need help with a JIRA query that when run produces the following: Not at programmer but any help is appreciated.
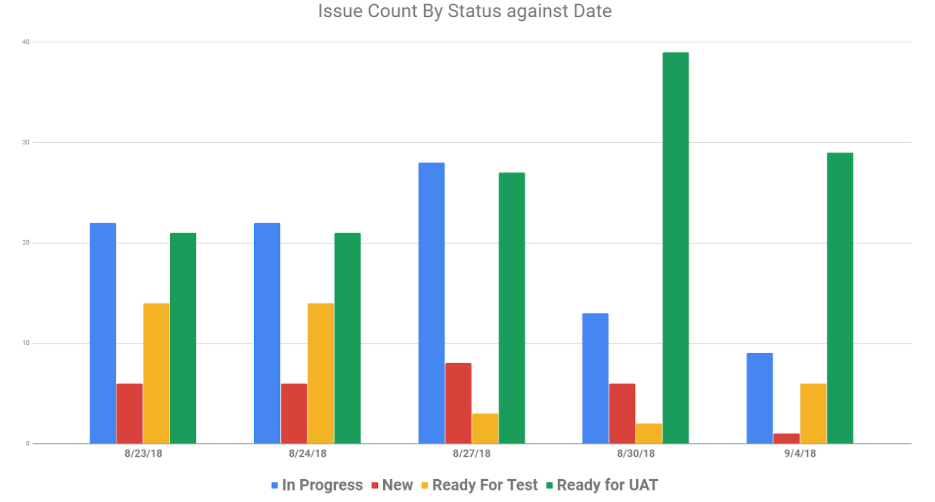
- Total number of tickets in a given date and or range in In-Progress, New, Ready For Test and Ready for UAT status.
- e. Today is Friday 9/7/18, I want to be able to capture all of the tickets say from 9/3/18 through 9/7/18
- When I run the query I want to get those tickets that fit the criteria.
- Then be able to produce a chart like this :
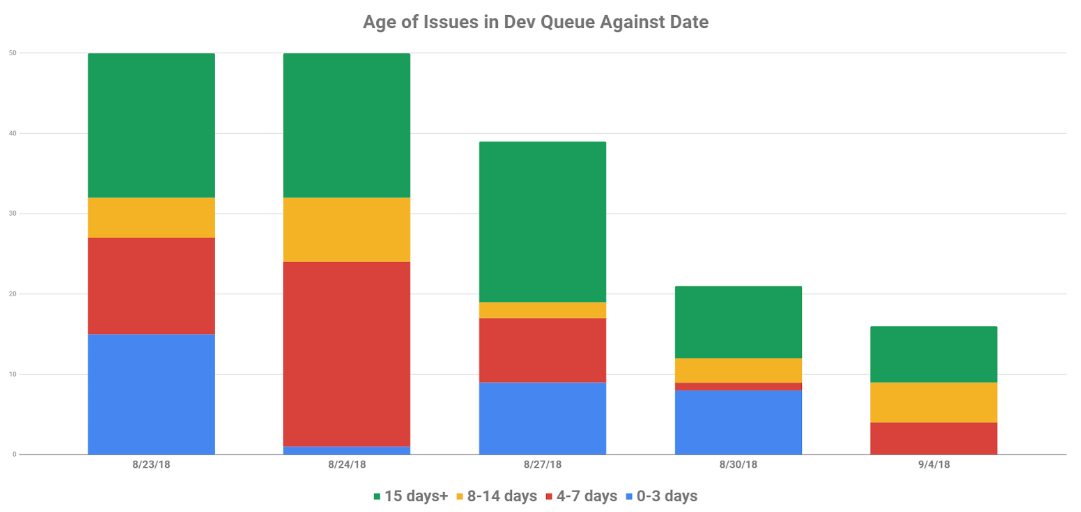
- A second query to produce the Total number of issues in Dev Queue in a given date that fit the following criteria:
- 0-3 days old
- 4-7 days old
- 8-14 days old
- 15 + days old
- Dev Queue definition = all tickets that are marked as In Progress, New, Ready for Test status
- Run the query and produce a chart like this:
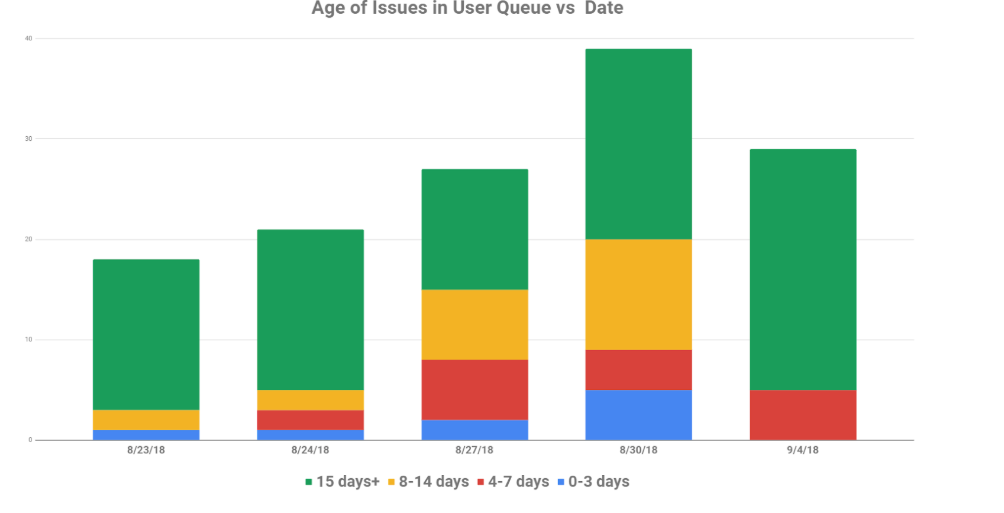
- Run a 3rd query , this time for those tickets in the User Queue bucket that are older that xyz number of days and per day and that fit the following criteria
- 0-3 days old
- 4-7 days old
- 8-14 days old
- 15 + days old
- User Queue definition = All tickets marked at Ready for UAT status
- Run this query and produce something like this
Current Process to get this data today:
- Run a JIRA filter for the JIRA projects I need
- Then Export the Results to Excel
- Once in Excel, I add 2 additional columns called Age and Date
- Age = is the age of the ticket in days, using the DateDif formula
- Date = Today’s date, say 9/4/17 which is then compared with the Created column from the Export.
- Now my Excel data is ready for Pivot tables or for sorting/filtering to get the data I need.
- Very manual work as I am not a programmer. So Any help is appreciated.
Thanks,
Victor Gomez