I was trying to understand Jira's epic report when I got confused by the way the report counts issues.
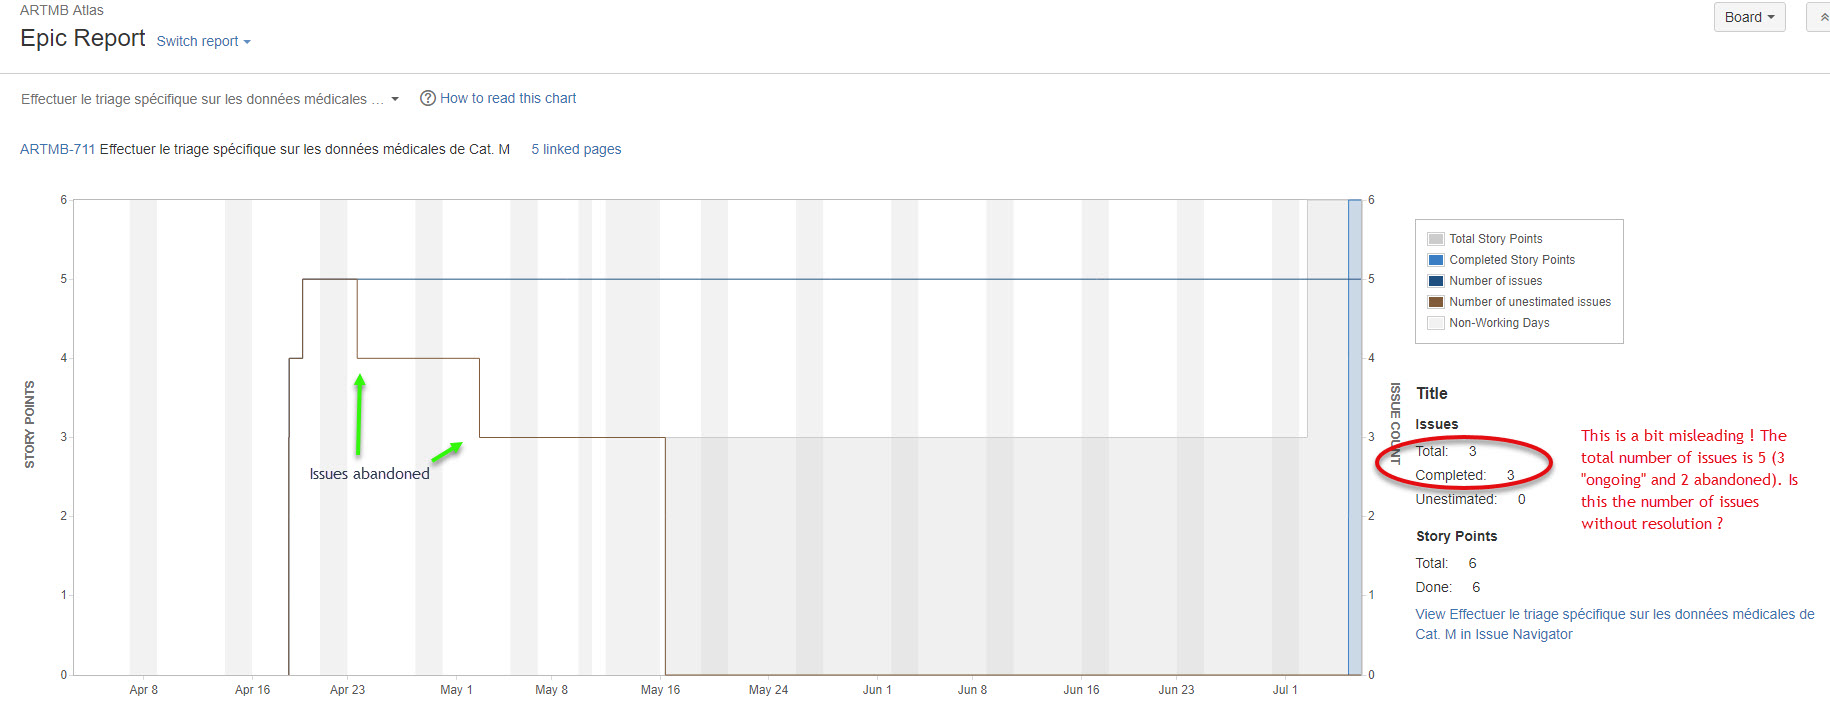
According to the char, there are 5 issues in this epic. 2 of them have been abandoned at the end of April/beginning of May while the other 3 have been implemented some time in early July. However, the statistics on the right say that there the total number of issues is 3, all of which have been completed.
I would have expected the "Total" in the statistics to match the dark blue line (5 in this example). The number of completed issues is in the statistics but not the chart, but I would have expected it to be 5 as well (3 Done + 2 Abandoned).
Does anyone know the exact formula for these stats ? Are they related to the "Resolution" of each issue (somethin like: "Total" = Nr. of issues with unresolved "Resolution" or "Completed" = Nr. of issues with "Resolution" == "Done" ?)