I'm trying to count issues completed versus not completed to get a projection towards a release.
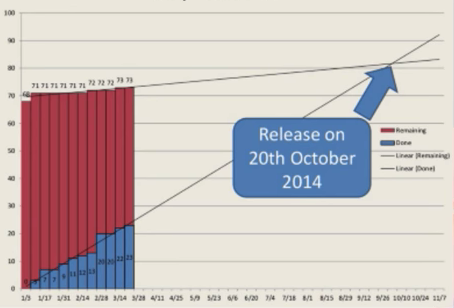
In other words, I'd like a chart that shows a projection of issues open and closed each day and a trendline of each to see when they cross.
The version report kind of gives this but it seems to be based on story points and we're just counting issues. The other issue with the version report is that it assumes flat scope from today until the release date (which is never true).
Any suggestions would be appreciated. Thanks!


