Hello all!
I have searched the Internet and didn't find the answer I was looking for. I hope some of you can help me. What do I need?
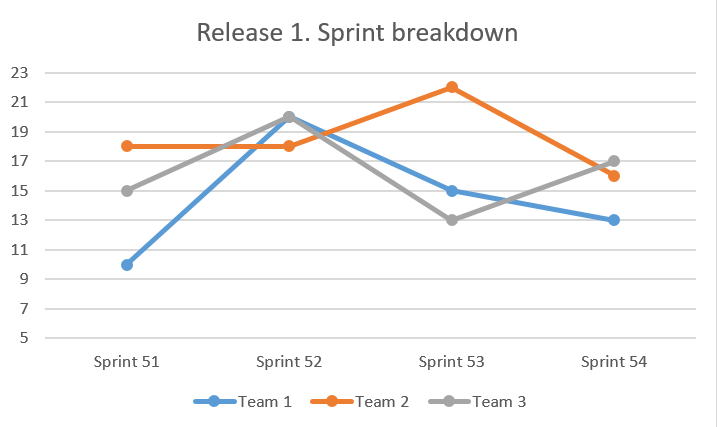
- analytics in form of a chart
- a horizontal scale should show all sprints related to release (or 5-6 sprints ahead)
- a vertical scale should show story points
- the chart should show each time and number of story points assigned to them on each sprint
Please see excel example of such chart.
Thanks in advance!

