Hi, I'm struggling to find a way to add markers (values) to a line graph created using the Chart Macro. Any suggestions please? I need something like this:
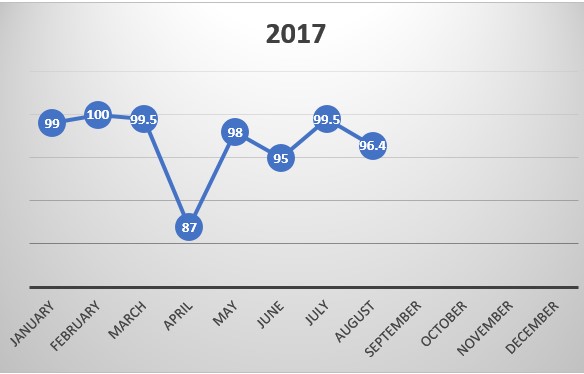
But so far managed to achieve this:
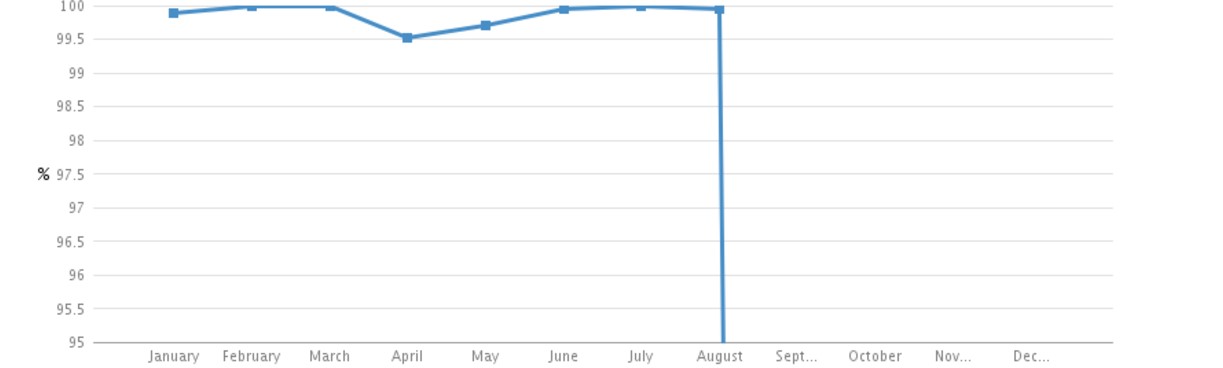
I don't mind the colours etc., I can change these but the values in the chart vary by so little, that I need to display the actual value in the graph.
The other issue is that I want to be adding data each month so don't want it to show "0" for September onwards. Any ideas please?
Thanks!

