We must accept that AI agents are moving from experimentation to execution.
Teams are now using autonomous agents for many activities on their board which includes investigate issues, write code, update Jira tickets, generate documentation, and perform smaller engineering tasks asynchronously.
But this creates a new question for engineering leaders:
How do you know whether your AI agents are actually delivering value?
Counting tokens, API calls, or lines of generated code doesn't answer that question.
The more useful metric is much closer to the way we already measure engineering work:
What did the agent work on, how long did it work, and what was the quality of the outcome?
1. Move from AI consumption to engineering outcomes
Most AI dashboards focus on consumption:
-
Tokens used
-
API calls
-
Agent sessions
-
Model costs
-
Code generated
These are useful operational metrics, but they don't directly represent business value.
Consider two agents:
Agent A
Agent B
Which agent delivered more value?
Probably Agent B.
This is why Issues Touched is a much more meaningful starting point than token consumption. It connects AI activity to the actual engineering backlog.
2. Introduce Machine Velocity
Human engineers naturally have work patterns that Jira can measure.
AI agents are different.
An agent may start working on an issue while the developer is offline, continue asynchronously, and eventually complete the task or hand it back to a human.
This creates a new measurement:
Machine Velocity
Machine Velocity = AI Agent Active Time + Issues Touched + Outcome Quality
The important part is active time.
If an agent is assigned to an issue at 10:00 and the task is completed at 10:30, you have a 30-minute machine work session.
If a developer takes over at 10:18, however, the agent should not continue accumulating time until 10:30.
The human takeover becomes an important boundary.
This distinction matters because otherwise AI activity can distort team velocity and capacity planning.
3. Measure Cost per Resolved Issue
Once you know the agent's active duration, you can start asking more useful financial questions.
For example:
Agent operating cost / Issues successfully resolved
You can also combine:
-
Agent active hours
-
Issues touched
-
Sessions completed
-
Human takeover rate
-
Human quality feedback
-
Rework rate
This gives engineering and finance teams a much clearer picture of AI ROI.
For example:
"Our AI agents worked on 250 Jira issues this month, consumed 120 active hours, and 82% of rated sessions were accepted without rework."
That is a much stronger management conversation than:
"We used 18 million AI tokens this month."
4. Quality is the Missing Half of AI ROI
There is another problem.
Activity does not equal productivity.
An agent that touches 1,000 issues but requires humans to fix most of its output is not necessarily delivering value.
This is where a simple human feedback loop becomes powerful.
After an agent session, ask:
👍 Good
👎 Needs Rework
Over time, you can answer questions such as:
-
Which agents produce the best outcomes?
-
Which agents require the most human intervention?
-
Which projects have the highest AI success rate?
-
Are agents becoming more effective?
-
Where are we spending machine capacity without getting quality outcomes?
This turns AI adoption from a technology experiment into something that can actually be managed.
5. What Should Engineering Leaders Track?
A practical AI-agent scorecard in Jira could look like this:
| Metric |
What it tells you |
|---|
| Issues Touched |
How much backlog the agents interacted with |
| Logged Hours |
How much active machine time was spent |
| Sessions Triggered |
How frequently agents are being used |
| Sessions Completed |
How much work reached a completion point |
| Human Takeover Rate |
How often humans had to intervene |
| Feedback Response Rate |
How much agent work is being evaluated |
| Good Quality Ratio |
How often humans accepted the result |
| Needs Rework Ratio |
Where AI is creating additional work |
This is the foundation of an AI workforce dashboard for engineering.
And importantly, these metrics can live alongside the work itself, rather than in a separate AI observability system.
Bringing This Into Jira
This is the problem we built and introduced AgentWorkLog last week on Atlassian Marketplace to to solve.
AgentWorkLog automatically tracks AI-agent activity across Jira and converts otherwise invisible machine work into measurable engineering activity.
It captures:
The important part is that it doesn't require developers to manually start or stop timers. AgentWorkLog detects any AI Agent's Jira activity on the Jira issue and then automatically manages the agent session lifecycle, including closing sessions when a human takes over.
What You Get
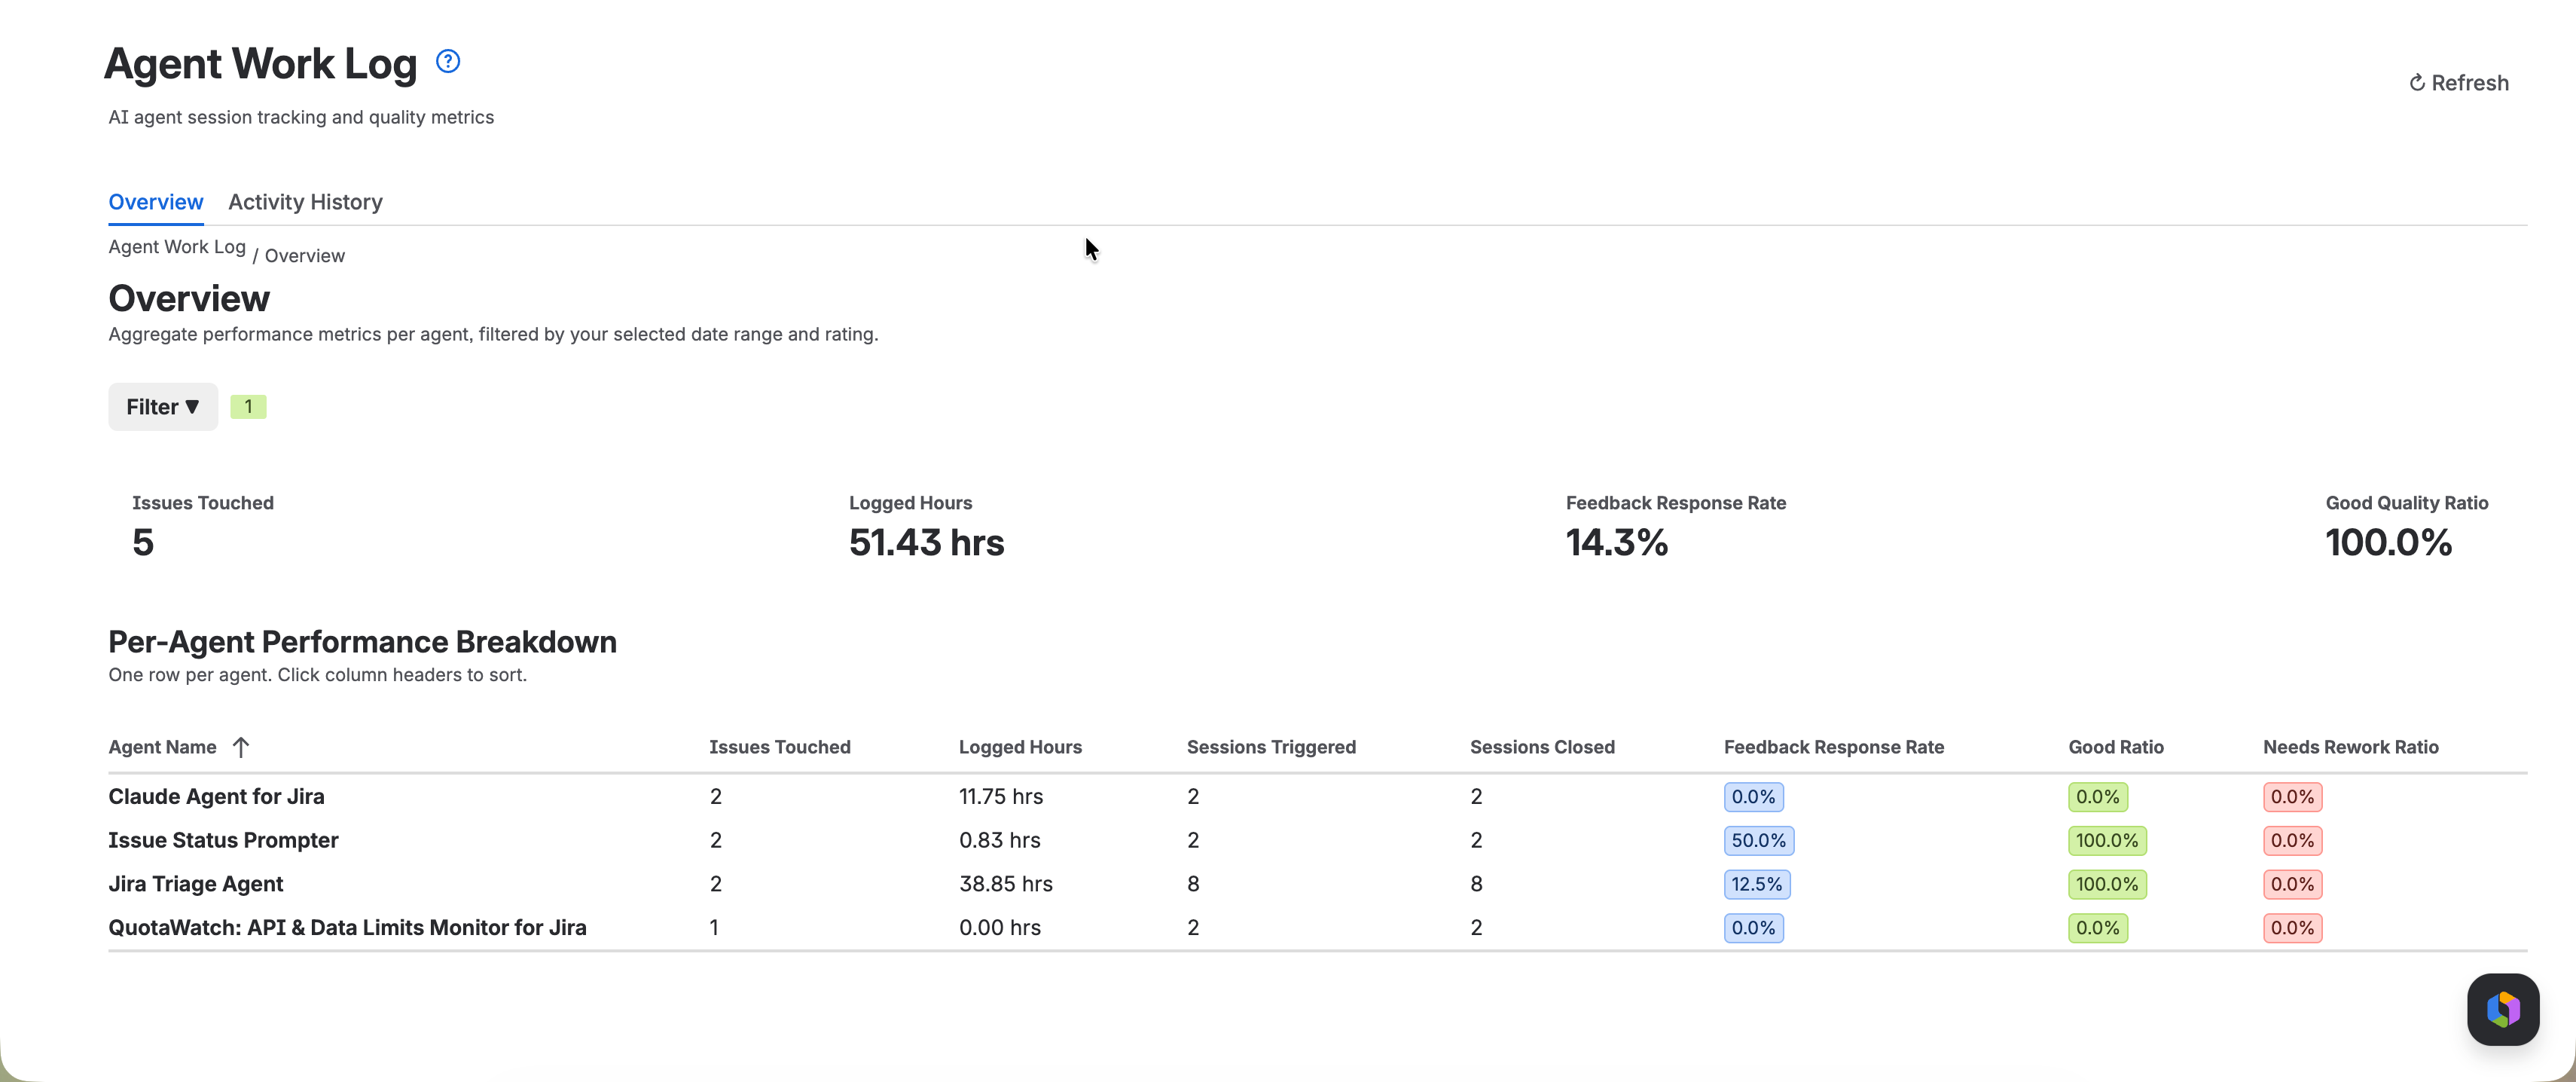
At the Jira level, teams can see metrics such as:
Issues Touched | Logged Hours | Sessions | Quality | Rework
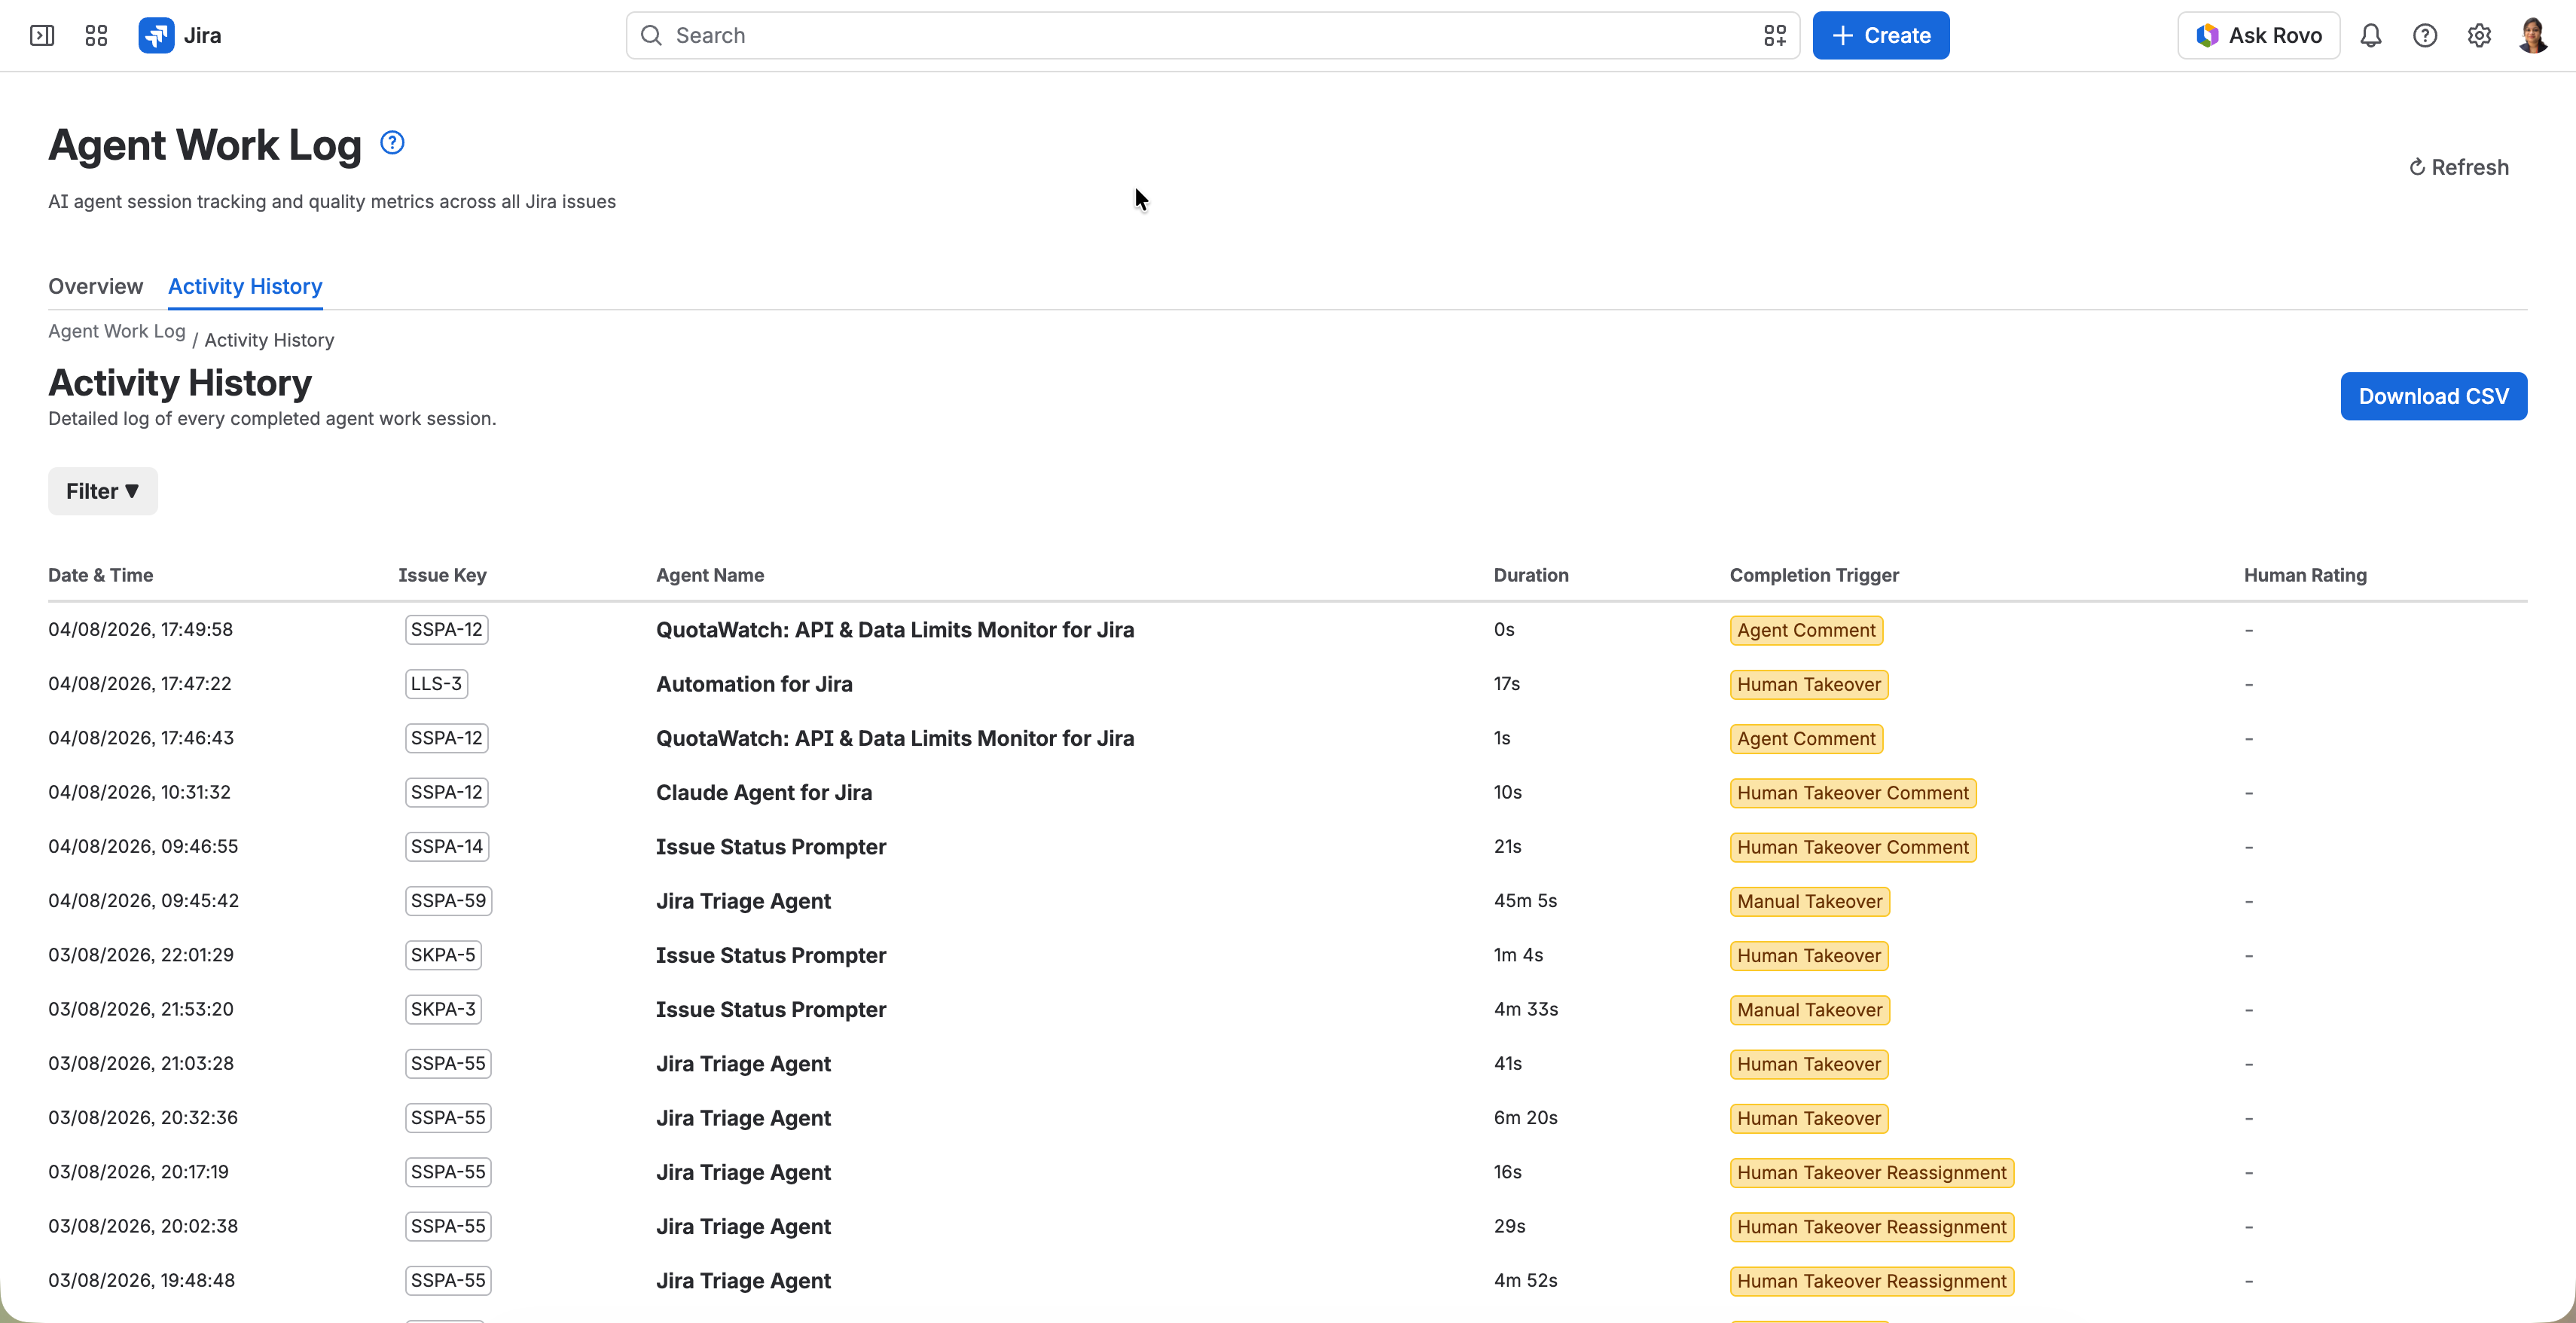
You can then drill down by agent, project, date range, or rating to understand where AI is actually contributing.
The global report provides site-wide agent performance, while project-level reporting lets teams evaluate AI activity within their own backlogs.
The bigger idea
AI agents are becoming another type of engineering capacity.
If organizations measure human capacity but treat machine capacity as a black box, they are missing half of the productivity picture.
The next generation of engineering management won't just ask, "How many developers do we have?"
It will also ask:
"How much work can our AI workforce actually deliver, at what cost, and with what quality?"
If your team is already using Rovo or other AI agents in Jira, AgentWorkLog gives you a practical way to start measuring that today.
Install AgentWorkLog and start building your AI workforce baseline.
