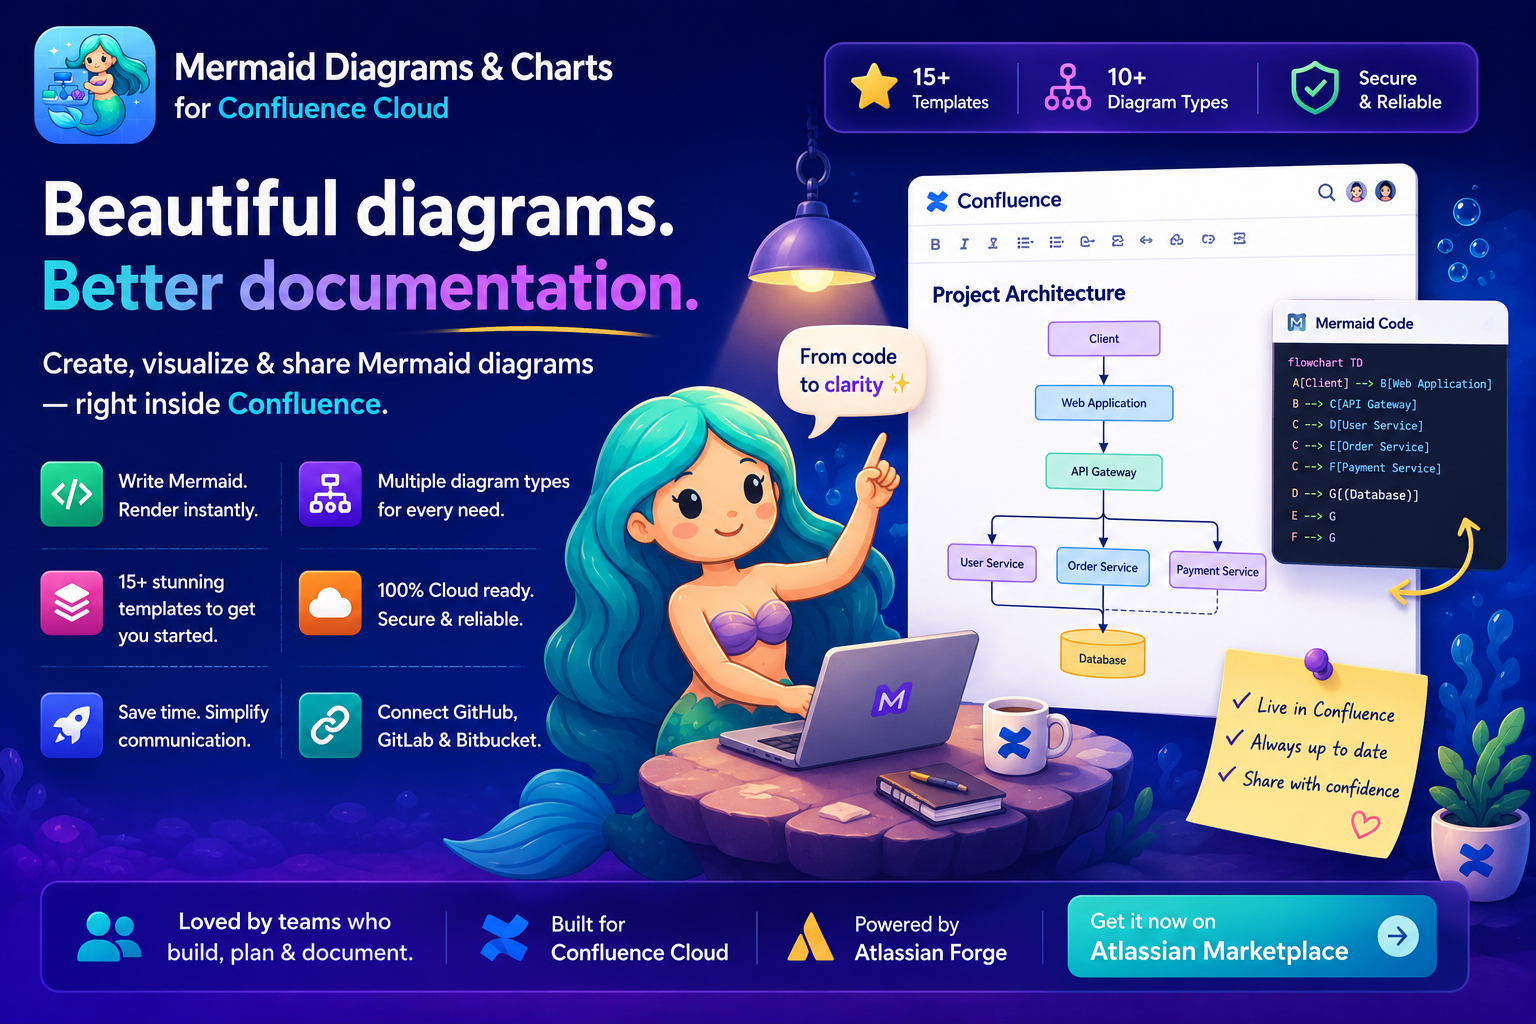
Turn ideas into powerful visual documentation — without leaving Confluence.
Are you still creating diagrams in external tools, exporting images, and pasting screenshots into your Confluence pages?
There's a better way. 💡
With Mermaid Diagrams & Charts for Confluence, you can create dynamic, code-based diagrams directly inside your Confluence pages — making your documentation easier to create, update, maintain, and share.
🧩 Why Use Mermaid Diagrams in Confluence?
Diagrams are an essential part of technical and business documentation.
Whether you're documenting a software architecture, explaining a business process, designing a database, or planning a project timeline, visual diagrams can make complex information much easier to understand.
The problem?
Traditional diagrams often become static images.
Someone updates the process → the screenshot becomes outdated.
Someone changes the architecture → the diagram needs to be recreated.
Someone wants to edit the diagram → you have to find the original file in another tool.
With Mermaid, your diagrams can live alongside your documentation as editable, maintainable, code-based diagrams.
✨ Create Diagrams Using Simple Mermaid Syntax
Instead of manually drawing every shape and connection, describe your diagram using Mermaid syntax.
For example:
<span>graph TD
    A[Customer] --> B[Website]
    B --> C{Order placed?}
    C -->|Yes| D[Payment]
    C -->|No| E[Exit]
    D --> F[Order Processing]
    F --> G[Delivery]</span>
Your Mermaid code becomes a visual diagram directly in your Confluence page.
This makes diagrams:
- ✅ Easy to edit
- ✅ Easy to maintain
- ✅ Version-friendly
- ✅ Fast to update
- ✅ Convenient for technical teams
And you don't need to switch between Confluence and another diagramming application.
📊 Create More Than Just Flowcharts
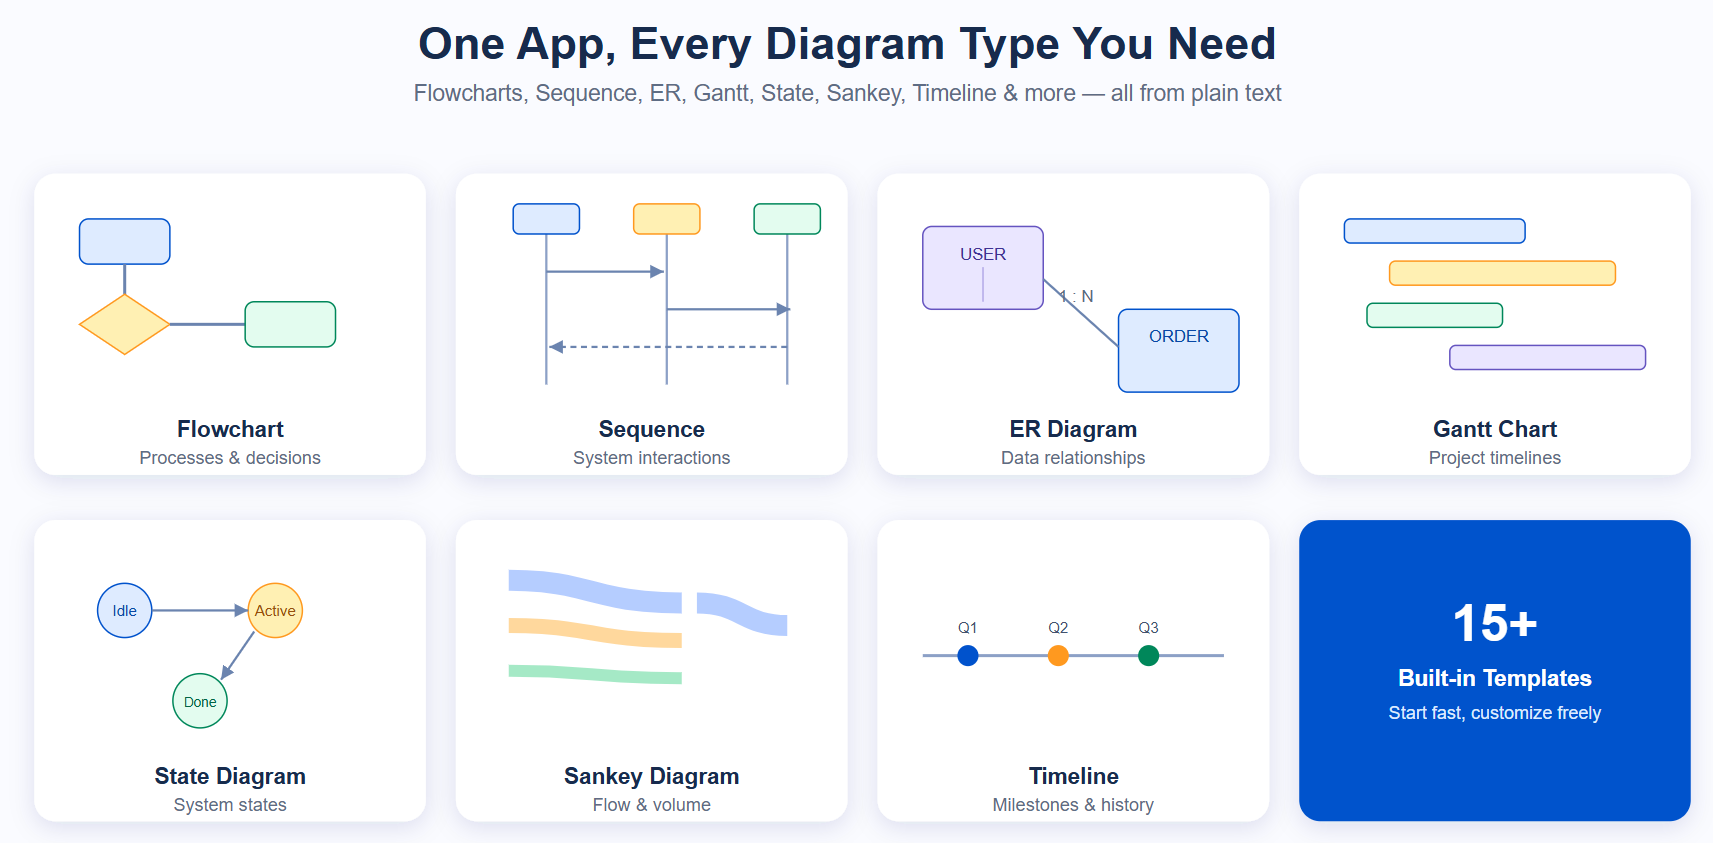
Mermaid supports a wide range of diagram types.
With Mermaid Diagrams & Charts for Confluence Cloud, you can create:
🔄 Flowcharts
Perfect for documenting business processes, workflows, decision trees, and application logic.
🔗 Sequence Diagrams
Visualize interactions between users, services, APIs, and systems.
🗄️ Entity Relationship Diagrams
Document database structures and relationships between entities.
📅 Gantt Charts
Create project schedules and visualize tasks and timelines.
🔀 State Diagrams
Show how an object or system moves between different states.
🌊 Sankey Diagrams
Visualize flows between different entities or stages.
⏱️ Timeline Diagrams
Present events, milestones, releases, and project history visually.
And there's much more to explore.
🚀 Get Started Quickly with 15+ Built-in Templates
Don't want to start from scratch?
The app includes 15+ built-in Mermaid templates to help you create diagrams quickly.
Templates make it easier to experiment with Mermaid and give your team a starting point for common documentation scenarios.
You can start with a template, modify the Mermaid code, and immediately see the result.
👀 See Your Diagram Render Instantly
One of the biggest advantages of working with Mermaid directly inside Confluence is the quick feedback loop.
Write or modify your Mermaid syntax → preview the diagram → refine it → publish.
No exporting.
No downloading images.
No uploading files.
No switching applications.
Just create and update your documentation in one place.
🔗 Connect Your Documentation with GitHub, GitLab & Bitbucket
For development teams, documentation often lives alongside source code.
The app can connect with popular code repositories including:
- 🐙 GitHub
- 🦊 GitLab
- 🪣 Bitbucket
This can make it easier to bring Mermaid-based documentation into the same workflow as your development repositories.
Instead of treating diagrams as isolated images, you can make them part of a more connected documentation process.
🤖 Use Rovo to Create and Visualize Mermaid Diagrams
AI is changing how teams create documentation.
With Rovo integration, you can use AI-assisted workflows to create and visualize Mermaid diagrams.
This can be particularly useful when you have a concept or process in your head but don't want to manually build the entire diagram from scratch.
Describe what you want to visualize and use Mermaid to turn the idea into a structured diagram.
☁️ Built for Confluence Cloud on Atlassian Forge
Mermaid Diagrams & Charts for Confluence is built specifically for Confluence Cloud using the Atlassian Forge platform.
That means your diagrams can live naturally within your Confluence documentation environment.
Your team can keep documentation, diagrams, technical explanations, architecture information, and processes together.
❌ Say Goodbye to Outdated Screenshots
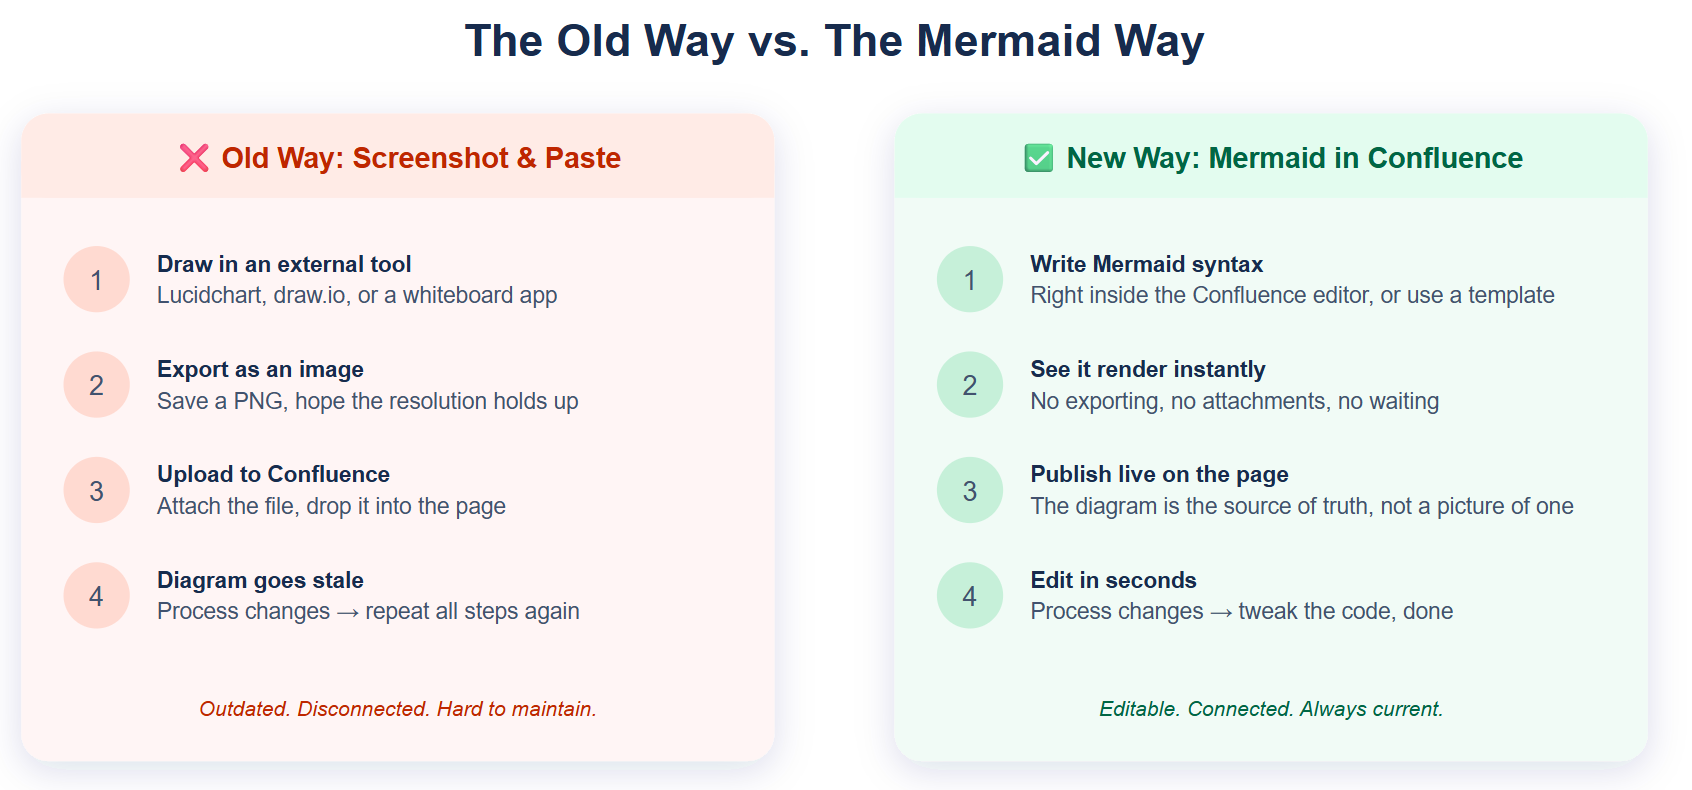
Think about a typical documentation workflow:
Old way:
Create diagram → Export image → Upload to Confluence → Publish → Process changes → Find original diagram → Update diagram → Export again → Replace screenshot.
😓
With Mermaid:
Create Mermaid diagram → Add it to Confluence → Update the Mermaid code when needed.
Much simpler.
Your documentation becomes more maintainable because the diagram isn't just a screenshot sitting on a page.
💡 Where Can You Use Mermaid Diagrams?
Here are a few examples.
🏗️ Software Architecture
Document services, APIs, databases, queues, and system dependencies.
🔌 API Documentation
Show how applications and services communicate.
🔄 Business Processes
Explain workflows and decision-making processes.
🗄️ Database Design
Visualize entities and their relationships.
📅 Project Planning
Use Gantt charts and timelines to communicate project schedules.
👥 Team Documentation
Create onboarding diagrams, operational workflows, troubleshooting flows, and process documentation.
📚 Technical Knowledge Bases
Turn complicated technical concepts into easy-to-understand visual documentation.
🎯 Why Living Diagrams Are Better
A diagram shouldn't become obsolete the moment your system changes.
With code-based diagrams, updating the source can be much easier than recreating an entire diagram manually.
That makes Mermaid especially useful for teams working with:
- Software architecture
- Agile development
- DevOps
- APIs
- Engineering documentation
- Business processes
- Database design
- Project planning
- Technical documentation
Your documentation evolves.
Your diagrams should evolve with it.
🌟 Turn Your Confluence Pages into Living Documentation
Confluence is already where teams document their knowledge.
Why send your diagrams somewhere else?
With Mermaid Diagrams & Charts for Confluence Cloud, you can bring visual documentation directly into your Confluence pages.
Create. Edit. Visualize. Maintain.
All in one place.
🚀 Ready to Try Mermaid in Confluence?
Mermaid Diagrams & Charts for Confluence is FREE to try.
👉 Get started today and create your first Mermaid diagram directly inside Confluence.
Try Mermaid Diagrams & Charts for Confluence on Atlassian Marketplace
What will you build first?
🔄 A workflow?
🏗️ An architecture diagram?
🔗 An API sequence?
🗄️ An ER diagram?
📅 A project timeline?
Start turning your ideas into living visual documentation inside Confluence. 🚀
