Jira logs every change to work items, but extracting the right insights from their history is where teams often fall short.
If you've ever wondered "How long was this work item in review?" or "Why was this ticket reassigned five times?" or "Which fields change the most?", you've probably faced the limits of Jira's built-in history view. It works well for looking at individual tickets, but not for trends, audits, or detailed reports.
This is where advanced Excel reports in Issue History for Jira (Work Item History) app can help. Let's take a look at them and explore how their usage can make Jira work item change tracking more powerful.
How to Export Advanced Excel Reports in Issue History for Jira
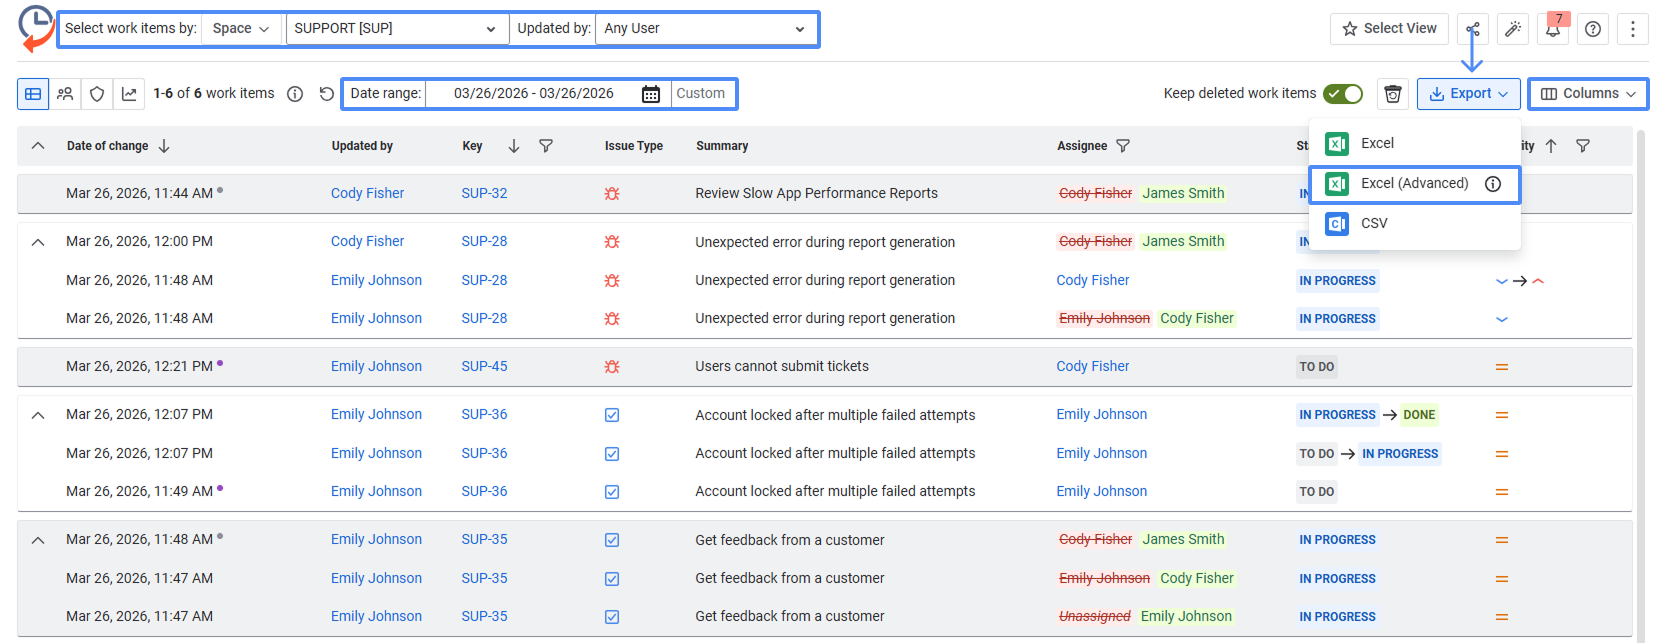
To export advanced Excel reports:
- Go to Issue History for Jira app.
- Apply filters (choose the needed space, date range, updater, etc.).
- Select the needed fields in the Column section.
- Select Export (upper right-hand corner) and then Excel (Advanced).
What you get:
- 4 advanced Excel reports based on the applied filters
- Pre-calculated metrics
- Ready-to-use audit data
Use Excel (Advanced) export to get deeper insights, not just work item history.
Now, let’s explore each report included in the advanced export in detail.
1. Field Changes Duration Report
Field changes duration report allows teams to see not only what has changed in Jira work items but also how long it took for the change to occur.
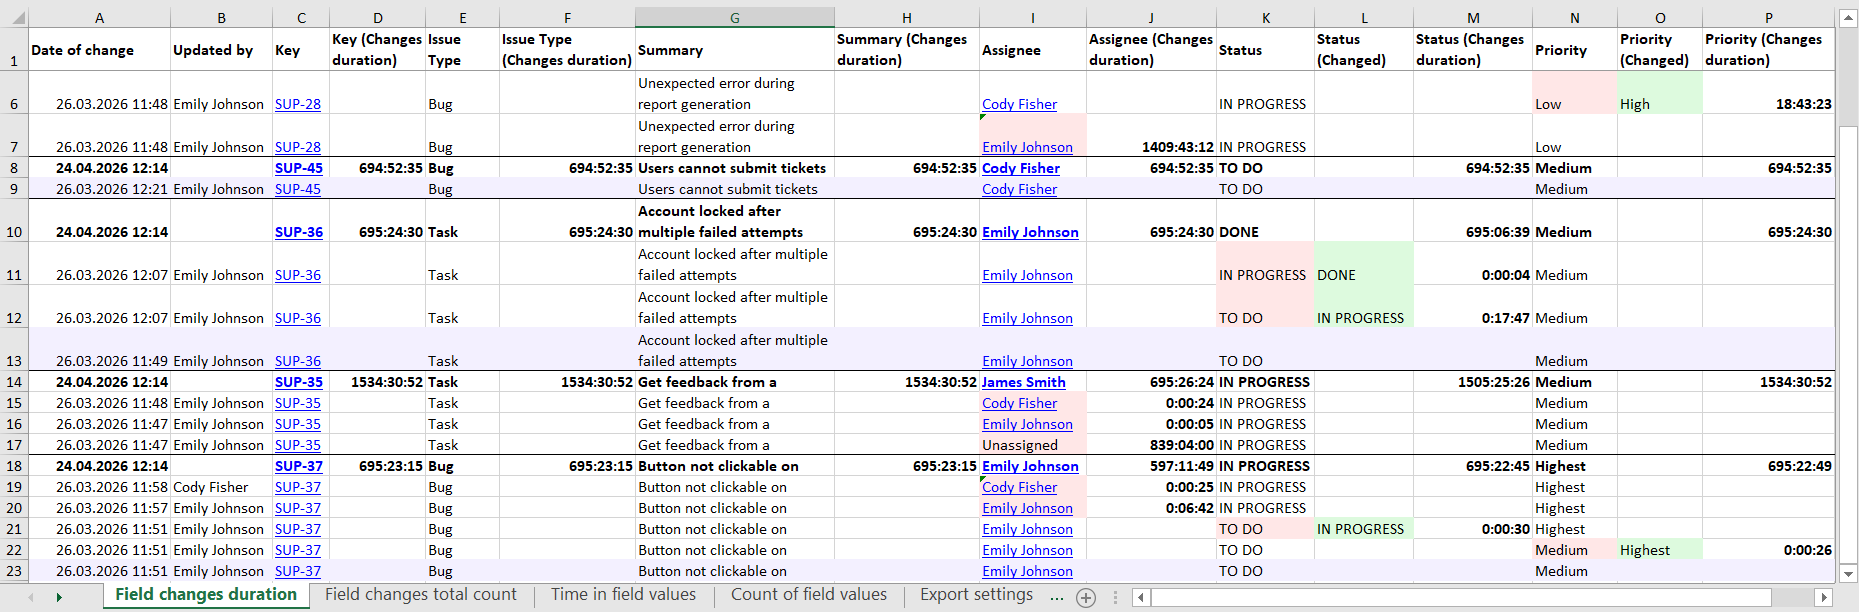
This report will calculate the time between changes of selected fields as you specify in the report table. Rather than having to calculate the duration between each change, you can get exact duration metrics at your fingertips in the app and in the exported Excel.
Examples of what data you can get with this report:
- Duration between status changes (e.g., In Progress → Done)
- Time between changes in assignee
- Time between priority changes
The report has a row for each change event, with extra columns to calculate the time between changes.
This report is particularly useful if you need to:
- Identify workflow bottlenecks
- Analyze team responsiveness
- Analyze delays between key actions
2. Field Changes Total Count Report
Field changes total count report helps teams track the total count of changes in selected fields of Jira work items.

This report counts changes for each field you select, based on your settings in the report table. Rather than counting updates in the work item history, you get a simple view in the downloadable Excel file.
Here are some examples of what you can track:
- Count of status updates
- Number of assignee updates
- Number of priority updates
- Total number of field updates across work items
The report usually provides a summary for each work item, indicating the number of changes made to each field and the total number of changes.
This report is useful if you want to:
- Detect unstable processes (too many status changes)
- See the frequent reassignments
- Track when priorities or other fields (including the custom ones) were frequently changed
3. Time in Field Values Report
Time in field values report helps teams to view how long Jira work items have spent in each field value over time. The report is about time in value, and it will help you visualize how time is spent in your workflow (not just between value changes, but in each value).

The report calculates the duration a work item has spent in each field value based on the settings used during the report generation in the app. Instead of manually reconstructing timelines, you get a clear breakdown directly in the exported Excel.
Here's some of the information you can retrieve with this report:
- Time spent in each status
- Time assigned to each user
- Time spent in each priority level
- Time spent in each work item type or other fields
It can be used if you want to:
- Identify bottlenecks quickly (e.g., time in In Progress status)
- Analyze team workload distribution
- Evaluate process effectiveness
4. Count of Field Values Report
Count of field values report allows to understand how many times each field value was used in work items.

The report automatically counts the number of times the field values have been used according to your report table settings. Rather than going through the history, you have a summary in the exported Excel.
Here are some examples of data you'll get from this report:
- The number of times each status (e.g., In Progress, Done) was applied
- Number of assignments per user
- Number of times each priority was used
This report counts values per work item and in total, making it straightforward to see patterns across many work items.
This report is useful if you want to:
- Understand the workflow (which statuses are often moved to)
- Identify heavily involved team members
- See breakdown by priority or work item type
- Identify anomalies or frequent changes
- Create summaries for dashboards
Who Can Benefit from Advanced Jira History Reports
Project Managers
Monitor workflows, detect bottlenecks, identify problems in delivery, and track delays in features or bugs.
Team Leads / Engineering Managers
Track team velocity, resource allocation and bottlenecks.
Support Teams
Understand how long it takes to resolve a ticket, identify bottlenecks and improve response rates.
Operations / Process Owners
Review processes, find bottlenecks, and improve efficiency based on the verified data.
Finance & Compliance Teams
Review changes to fields, approve actions, and generate reports to review for compliance.
