Your QBR is in three days. The VP asks, “So, are we meeting our SLAs?” You open your Jira, run a few filters, export tickets to Excel, and stare at 1,400 rows. You have data. A lot of it.
But do you have an answer?
That is the real problem with SLA reporting for quarterly business reviews. The issue is usually not a lack of data. The issue is that the data is not shaped into a story people can understand and act on.
What a QBR audience actually needs
QBRs are not daily operational meetings. The people in that room usually want to understand three things:
- Are we keeping our promises to customers?
- Where did we fail, and why?
- What are we doing about it next quarter?
Your SLA report should answer these questions. Nothing more, nothing less. A table with 47 metrics does not help if no one can explain what changed. A short report with clear compliance numbers, breach patterns, and next actions usually works much better.
Start with the metric that matters: SLA compliance rate 📈
Before you build any report, agree on the formula. It sounds basic, but many teams skip this step and then spend half the QBR arguing about numbers.
SLA Compliance Rate = Tickets resolved within SLA / Total tickets × 100
Calculate it by:
- Priority: P1, P2, P3, P4
- Request type or service category
- Team or queue
- Project
- Customer tier
- Region or support calendar
- Month within the quarter
This becomes the backbone of your SLA report. Everything else adds context.
For example, “91% SLA compliance” is not enough. 91% for which SLA? Which priority? Which service? Which team? Compared to what?
Without that context, the number is just decoration.
Block 1 – Quarter at a glance
Start with a short summary table. This section should help people understand the quarter in one minute.
|
Metric
|
Q3 Target
|
Q3 Actual
|
vs Q2
|
Comment
|
|
Overall SLA compliance
|
95%
|
91.3%
|
↓ 2.1%
|
P2 breaches increased
|
|
P1 compliance
|
99%
|
97.8%
|
↑ 0.5%
|
Stable, but low volume
|
|
P2 compliance
|
95%
|
88.4%
|
↓ 4.2%
|
Network queue delays
|
|
Avg. resolution time for P1
|
4h
|
3h 47m
|
Better
|
Within target
|
|
Open tickets already breached
|
–
|
18
|
↓ 6
|
Still needs weekly review
|
|
Breaches with RCA completed
|
–
|
83%
|
↑ 12%
|
Better follow-up process
|
Keep this table short. Five to eight rows are enough. If you need more rows, you probably have too many SLA targets in one view. That may be a separate configuration problem.
Block 2 – Compliance by priority
A single compliance number can hide serious problems.
For example, overall compliance may look fine because most low-priority tickets were resolved on time. But P1 or P2 tickets may still be weak. Use a breakdown like this:
|
Priority
|
Tickets
|
Met SLA
|
Exceeded SLA
|
Compliance rate
|
Main issue
|
|
P1
|
32
|
31
|
1
|
96.8%
|
One delayed escalation
|
|
P2
|
184
|
162
|
22
|
88%
|
Routing delays
|
|
P3
|
1,140
|
1,065
|
75
|
93.4%
|
Queue overload
|
|
P4
|
1,074
|
995
|
79
|
92.6%
|
Low-priority backlog
|
For QBRs, always separate high-priority work from normal ticket volume. A missed P1 SLA and a missed low-priority request should not carry the same weight in the conversation.
Block 3 – Breach breakdown
Do not list every breach. List the patterns. A useful breach breakdown looks like this:
- P2 / Network work items – 34 breaches, average breach by 2h 10m. Root cause: escalation routing delay.
- P3 / Software requests – 61 breaches, average breach by 48m. Root cause: queue not staffed on Fridays.
- Internal access requests – 22 breaches, average breach by 1d 4h. Root cause: approval waiting time was not visible.
Two or three categories are enough. If you are listing ten breach categories, you are probably describing chaos instead of analyzing it.
Block 4 – Compliance by service, project, or team
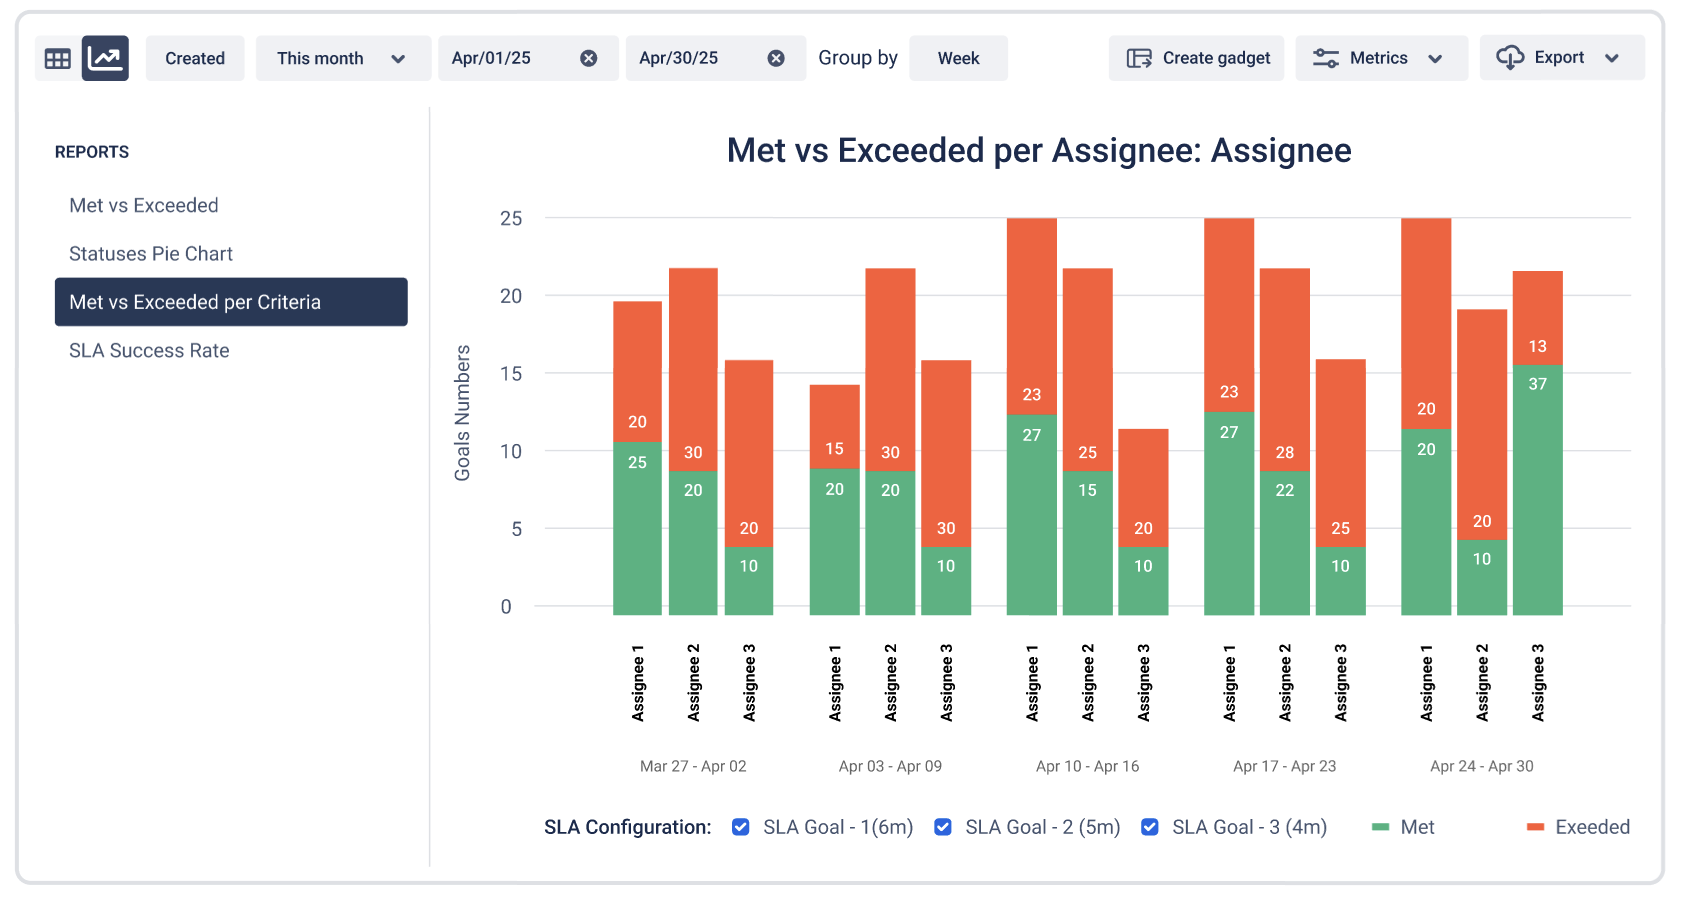
This part is useful when several teams work in the same Jira or JSM instance. Group results by the fields your team already uses:
- Project
- Request type
- Service
- Component
- Team
- Customer tier
- Region
- Severity
- Custom field values
Example:
|
Service / Area
|
Tickets
|
SLA compliance
|
Main issue
|
|
Billing Support
|
420
|
96%
|
Stable
|
|
Infrastructure
|
180
|
81%
|
Long resolution time
|
|
API Support
|
310
|
88%
|
Too many handoffs
|
|
Internal IT
|
260
|
93%
|
Good response, slower closure
|
|
Security Requests
|
74
|
79%
|
Approval delays
|
If your Jira issues already have fields like Service, Region, Team, Severity, or Customer Tier, use them in SLA reporting too. Otherwise, your report stays too general.
In SLA Time and Report for Jira, this type of analysis can be easily built with reports like Met vs Exceeded per Criteria, where you can review SLA results by selected Jira fields instead of checking only one general SLA number.
Block 5 – Trend line
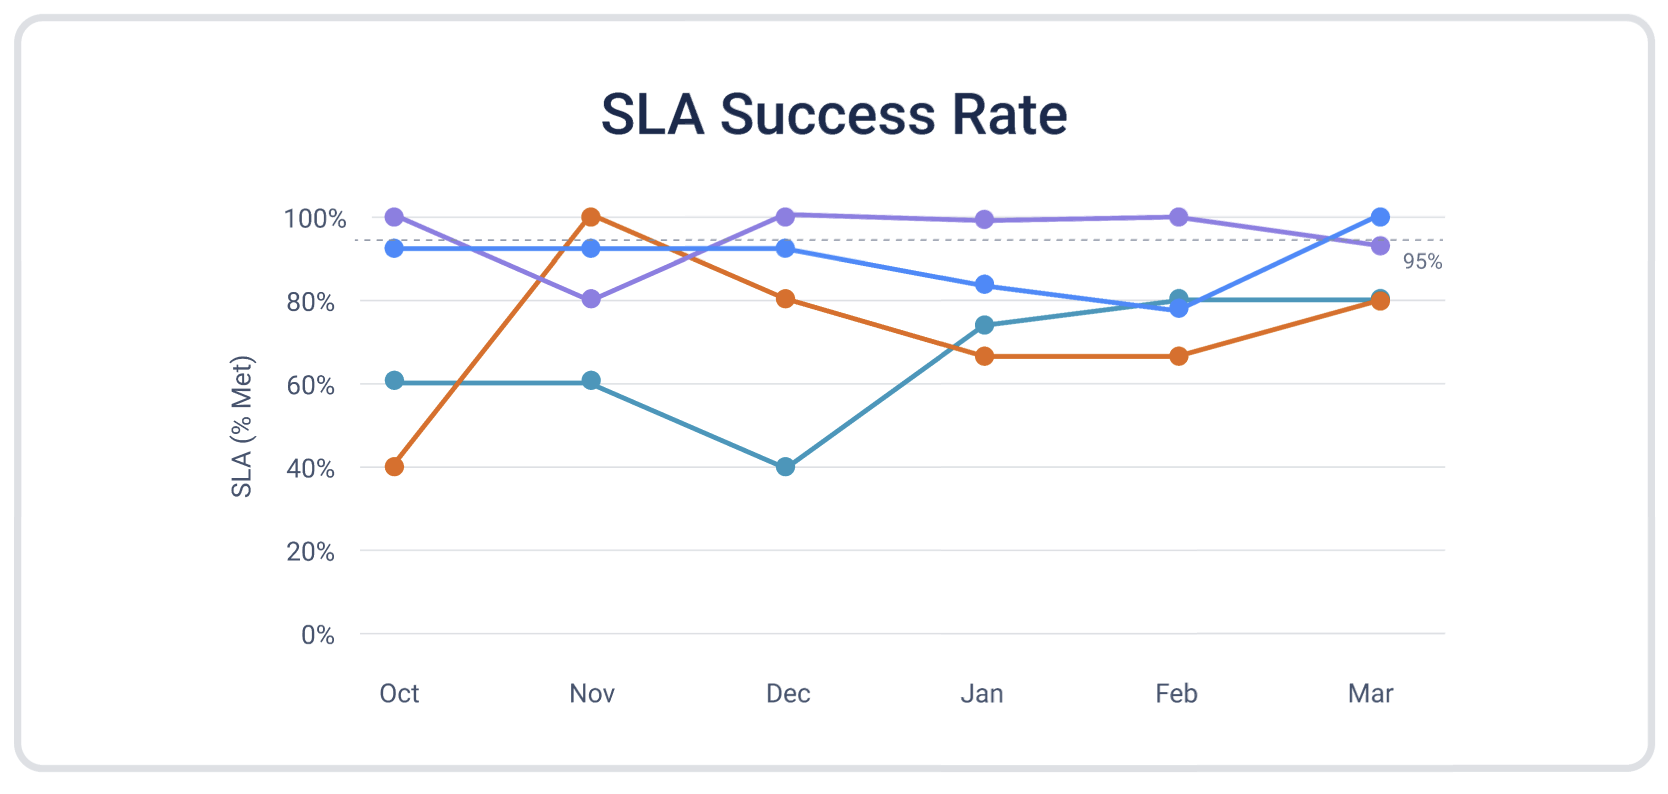
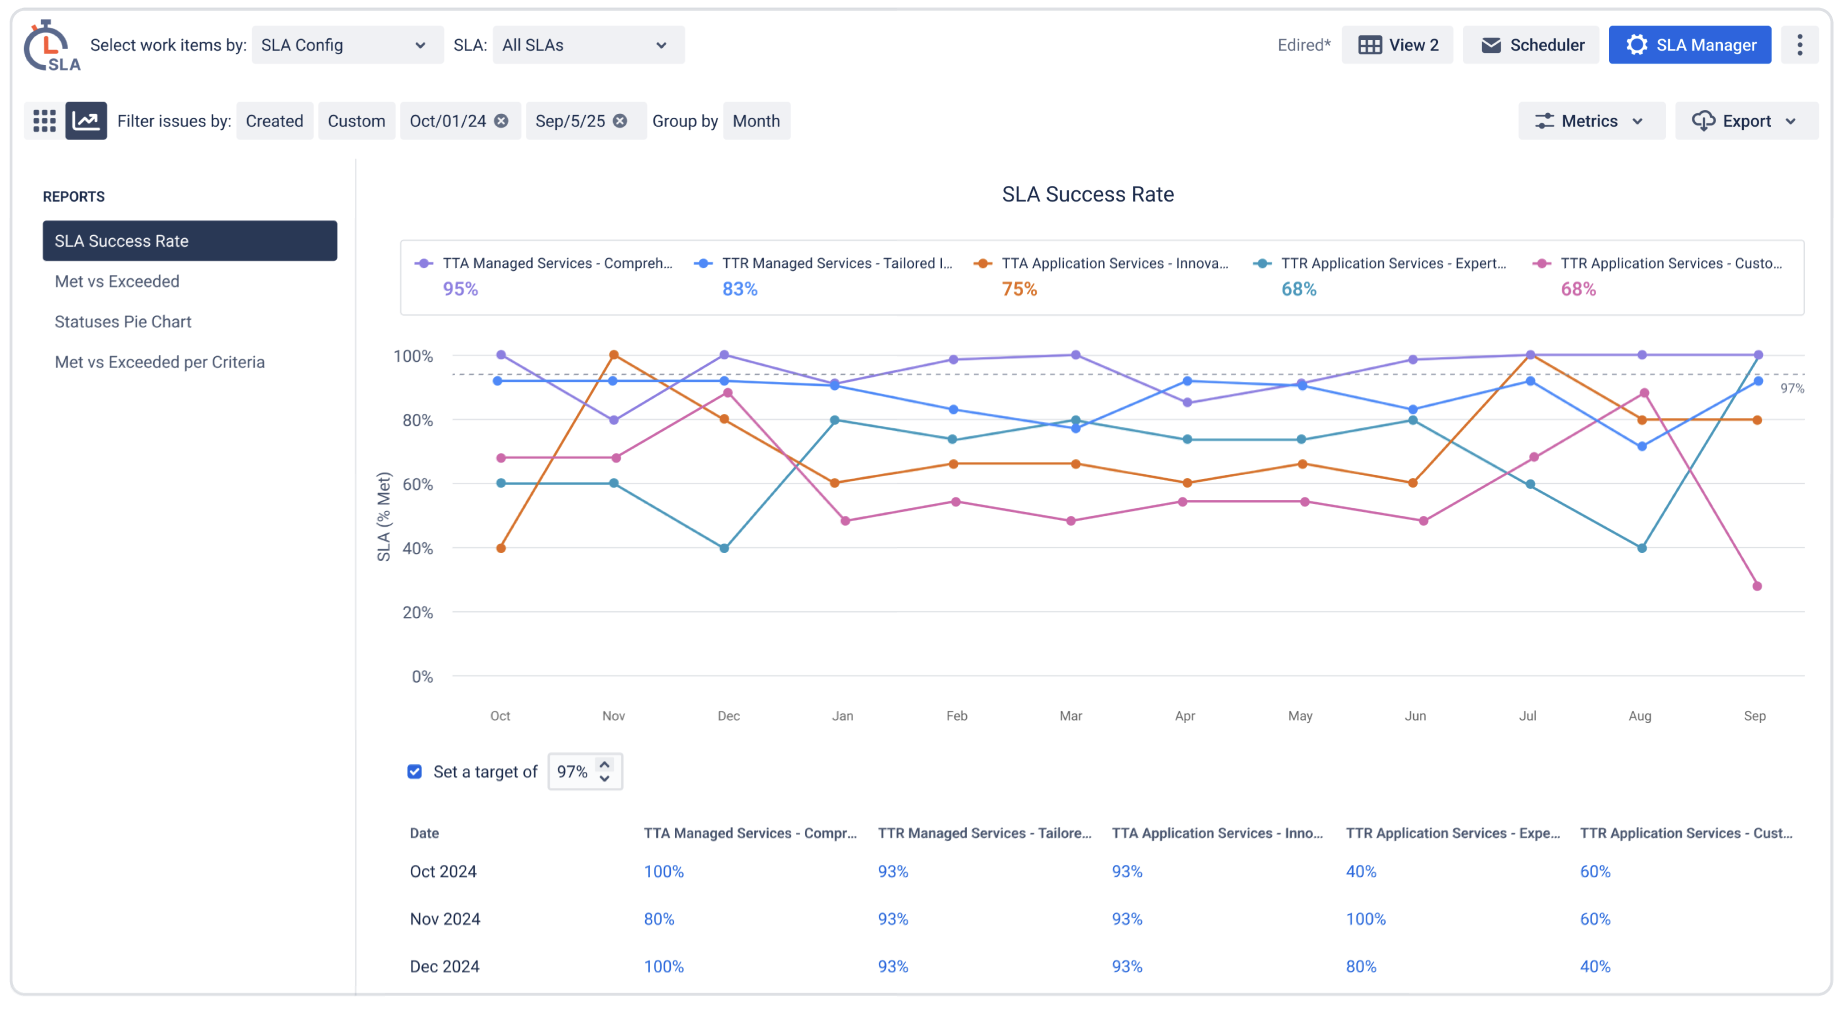
Show SLA compliance month by month across the quarter. Do not rely only on the quarterly average.
|
Month
|
SLA compliance
|
Tickets
|
Comment
|
|
July
|
94%
|
710
|
Stable month
|
|
August
|
86%
|
820
|
P2 network breaches increased
|
|
September
|
92%
|
900
|
Escalation process improved
|
If compliance dropped in August and recovered in September, the quarterly average hides the most useful part of the report.
A simple line chart works well here. Pie charts are less useful for QBRs because they show distribution, not movement.
If you use SLA Time and Report, the SLA Success Rate chart can help with this part because it shows how often teams meet SLA deadlines over time. For a QBR, that trend is usually more useful than a static count of met and breached tickets.
Block 6 – Open SLA risk
Many SLA reports focus only on resolved tickets. If you report only closed work, you may miss tickets that are already breached or close to breach but still open. Then the QBR looks fine, while the next escalation is already waiting in the queue.
Add a separate section for open risk:
|
Risk group
|
Number of tickets
|
What it means
|
|
Open and exceeded SLA
|
18
|
Already breached, still unresolved
|
|
Open and above 80% of SLA time
|
37
|
Needs attention before breach
|
|
Open P1/P2 tickets near breach
|
11
|
Should be reviewed with owners
|
|
Open tickets without assignee
|
24
|
Ownership gap
|
The question is not only, “What did we miss?” It is also, “What are we about to miss?”
Block 7 – Handoffs and internal OLAs
Many customer-facing SLA breaches are not caused by one team. They happen during handoffs.
For example:
- L1 Support waits for Infrastructure.
- Infrastructure waits for the Application Team.
- The Application Team waits for QA.
- QA waits for release approval.
Externally, the customer sees one SLA. Internally, several teams may be involved. For QBRs, add a handoff section:
|
Handoff
|
Average waiting time
|
SLA impact
|
Next action
|
|
Support → DevOps
|
6h 20m
|
High for P1/P2
|
Add escalation after 2 hours
|
|
DevOps → App Team
|
9h 10m
|
Medium
|
Define owner per component
|
|
App Team → QA
|
1d 4h
|
High for bug fixes
|
Add internal OLA
|
|
QA → Release
|
2d 1h
|
Medium
|
Review release window rules
|
This helps move the discussion away from blame. Instead of saying, “Support missed the SLA,” you can show where the work was waiting and which internal agreement needs attention.
Block 8 – Actions taken or planned
This is what separates a useful SLA report from a spreadsheet. For each major breach pattern, add one action.
|
Problem found
|
Action
|
Owner
|
Due date
|
Success measure
|
|
P2 network breaches increased
|
Update escalation path
|
Support Lead + DevOps Lead
|
Oct 1
|
P2 compliance above 94%
|
|
Too many unassigned tickets
|
Add automation after 30 minutes
|
Jira Admin
|
Oct 5
|
Unassigned time reduced by 50%
|
|
Waiting status used incorrectly
|
Review pause conditions
|
Jira Admin + Support Manager
|
Oct 10
|
Fewer false “met” tickets
|
|
Open breached tickets not visible
|
Add dashboard gadget or saved report
|
Support Manager
|
Oct 3
|
Weekly review started
|
Each action should have an owner, a date, and a way to check whether it worked. Without this block, the QBR becomes a postmortem. With it, the QBR becomes a feedback loop.
Getting the data out of JSM
Jira Service Management gives you useful SLA data, but it does not always give you the exact QBR report you need. Here are a few practical paths.
✔️ Option 1 – JQL + export
Write a JQL query for your date range and SLA fields:
project = "IT Support" AND created >= "2024-07-01" AND created <= "2024-09-30" ORDER BY priority ASC
Export to CSV. Add a column in Excel:
=IF([Time to resolution]<=[SLA target], "Met", "Breached")
Then pivot by priority and month. Not elegant, but it works and it's auditable.
✔️ Option 2 – Marketplace reporting app
If you prepare SLA reports every quarter across multiple projects or teams, it is usually better to build repeatable reports instead of rebuilding spreadsheets every time. Also, in the app, you can configure the Report Scheduler, set up chart views with selected filters such as SLA, date, status, and more, and export reports in the required format without having to build JQL queries.
For example, SLA Time and Report for Jira can help when you need:
- SLA Grid reports for detailed review
- Met vs Exceeded or Pie Charts
- Met vs Exceeded per Criteria by selected Jira or Custom fields
- SLA Success Rate charts for trend reporting
- Jira dashboard gadgets for ongoing visibility
- Reports across different SLA configurations and project contexts
- Report Scheduler to send recurring reports to stakeholders without preparing them manually each time
- Export options for sharing SLA data in the required format
🔴 Five things that make SLA reports fail
- Mixing "paused" time into breaches
JSM pauses SLA timers when a ticket is waiting for customer response. If your export doesn't account for this, your breach numbers are wrong. Always check whether your data reflects elapsed calendar time or active SLA time.
- Reporting on tickets, not on volume
100 P1 tickets with 3 breaches (97% compliance) looks very different from 5 P1 tickets with 3 breaches (40% compliance). Always show total volume next to compliance rate.
- No benchmark
A 91% compliance rate — is that good? Compared to what? Your own Q2, your SLA target, or an industry benchmark? Without a reference point, a number means nothing.
- One aggregate number for the whole quarter
If compliance collapsed in August and recovered in September, a 91% quarterly average tells no one anything useful. Always show monthly breakdown.
- Skipping the "so what"
Data without interpretation is just a spreadsheet. Every report needs a short narrative: what happened, what it means, what comes next. Even two sentences per section is enough.
The template, summarized 🤝
For every SLA QBR section, use this structure:
- Compliance rate by priority. Include target, actual result, and change from last quarter.
- Top 2–3 breach patterns. Explain root cause, not every ticket.
- Month-by-month trend. Show whether performance improved, dropped, or stayed flat.
- Open SLA risk. Include open breached tickets and tickets close to breach.
- Service, team, or request type breakdown. Use Jira fields that match how your team actually works.
- Handoffs and internal OLAs. Show where work waits between teams.
- One action per pattern. Add owner, date, and success measure.
That is the report.
So before your next QBR, do not start with the export. Start with three questions:
Are we keeping our promises? Where are we failing? What are we changing next?
The report should simply make those answers clear. And if your current Jira reports still leave you answering these questions manually, try building your next QBR view with SLA Time and Report for Jira. Start with one or two key SLAs, compare met vs exceeded results, check open breached tickets, and review SLA Success Rate over the quarter. It is a practical way to turn SLA reporting from a spreadsheet cleanup into a repeatable review process.
