Hey agent builders!
Ever wondered how your Rovo agent comes up with its answers? Or wished you could peek under the hood to troubleshoot, optimize, or just satisfy your curiosity? We’re excited to introduce a new Debug View available right inside your Rovo Agent Chat experience.
Why Debug?
Building and maintaining smart agents can be tricky—especially when you can’t see what’s happening behind the scenes.
When your agent gives an unexpected answer (or just nails it!), it’s natural to wonder:
With the new Debug View, you get instant transparency—making it easier to troubleshoot, optimize, and understand your agents.
Why This Matters
Debug View empowers you to:
-
Build more reliable, transparent agents
-
Reduce support back-and-forth by self-serving common issues
-
Share actionable debug information with your team or Atlassian support
What’s New?
We’re starting with the essentials—making it easy to inspect your agent’s skills, right from the chat experience.
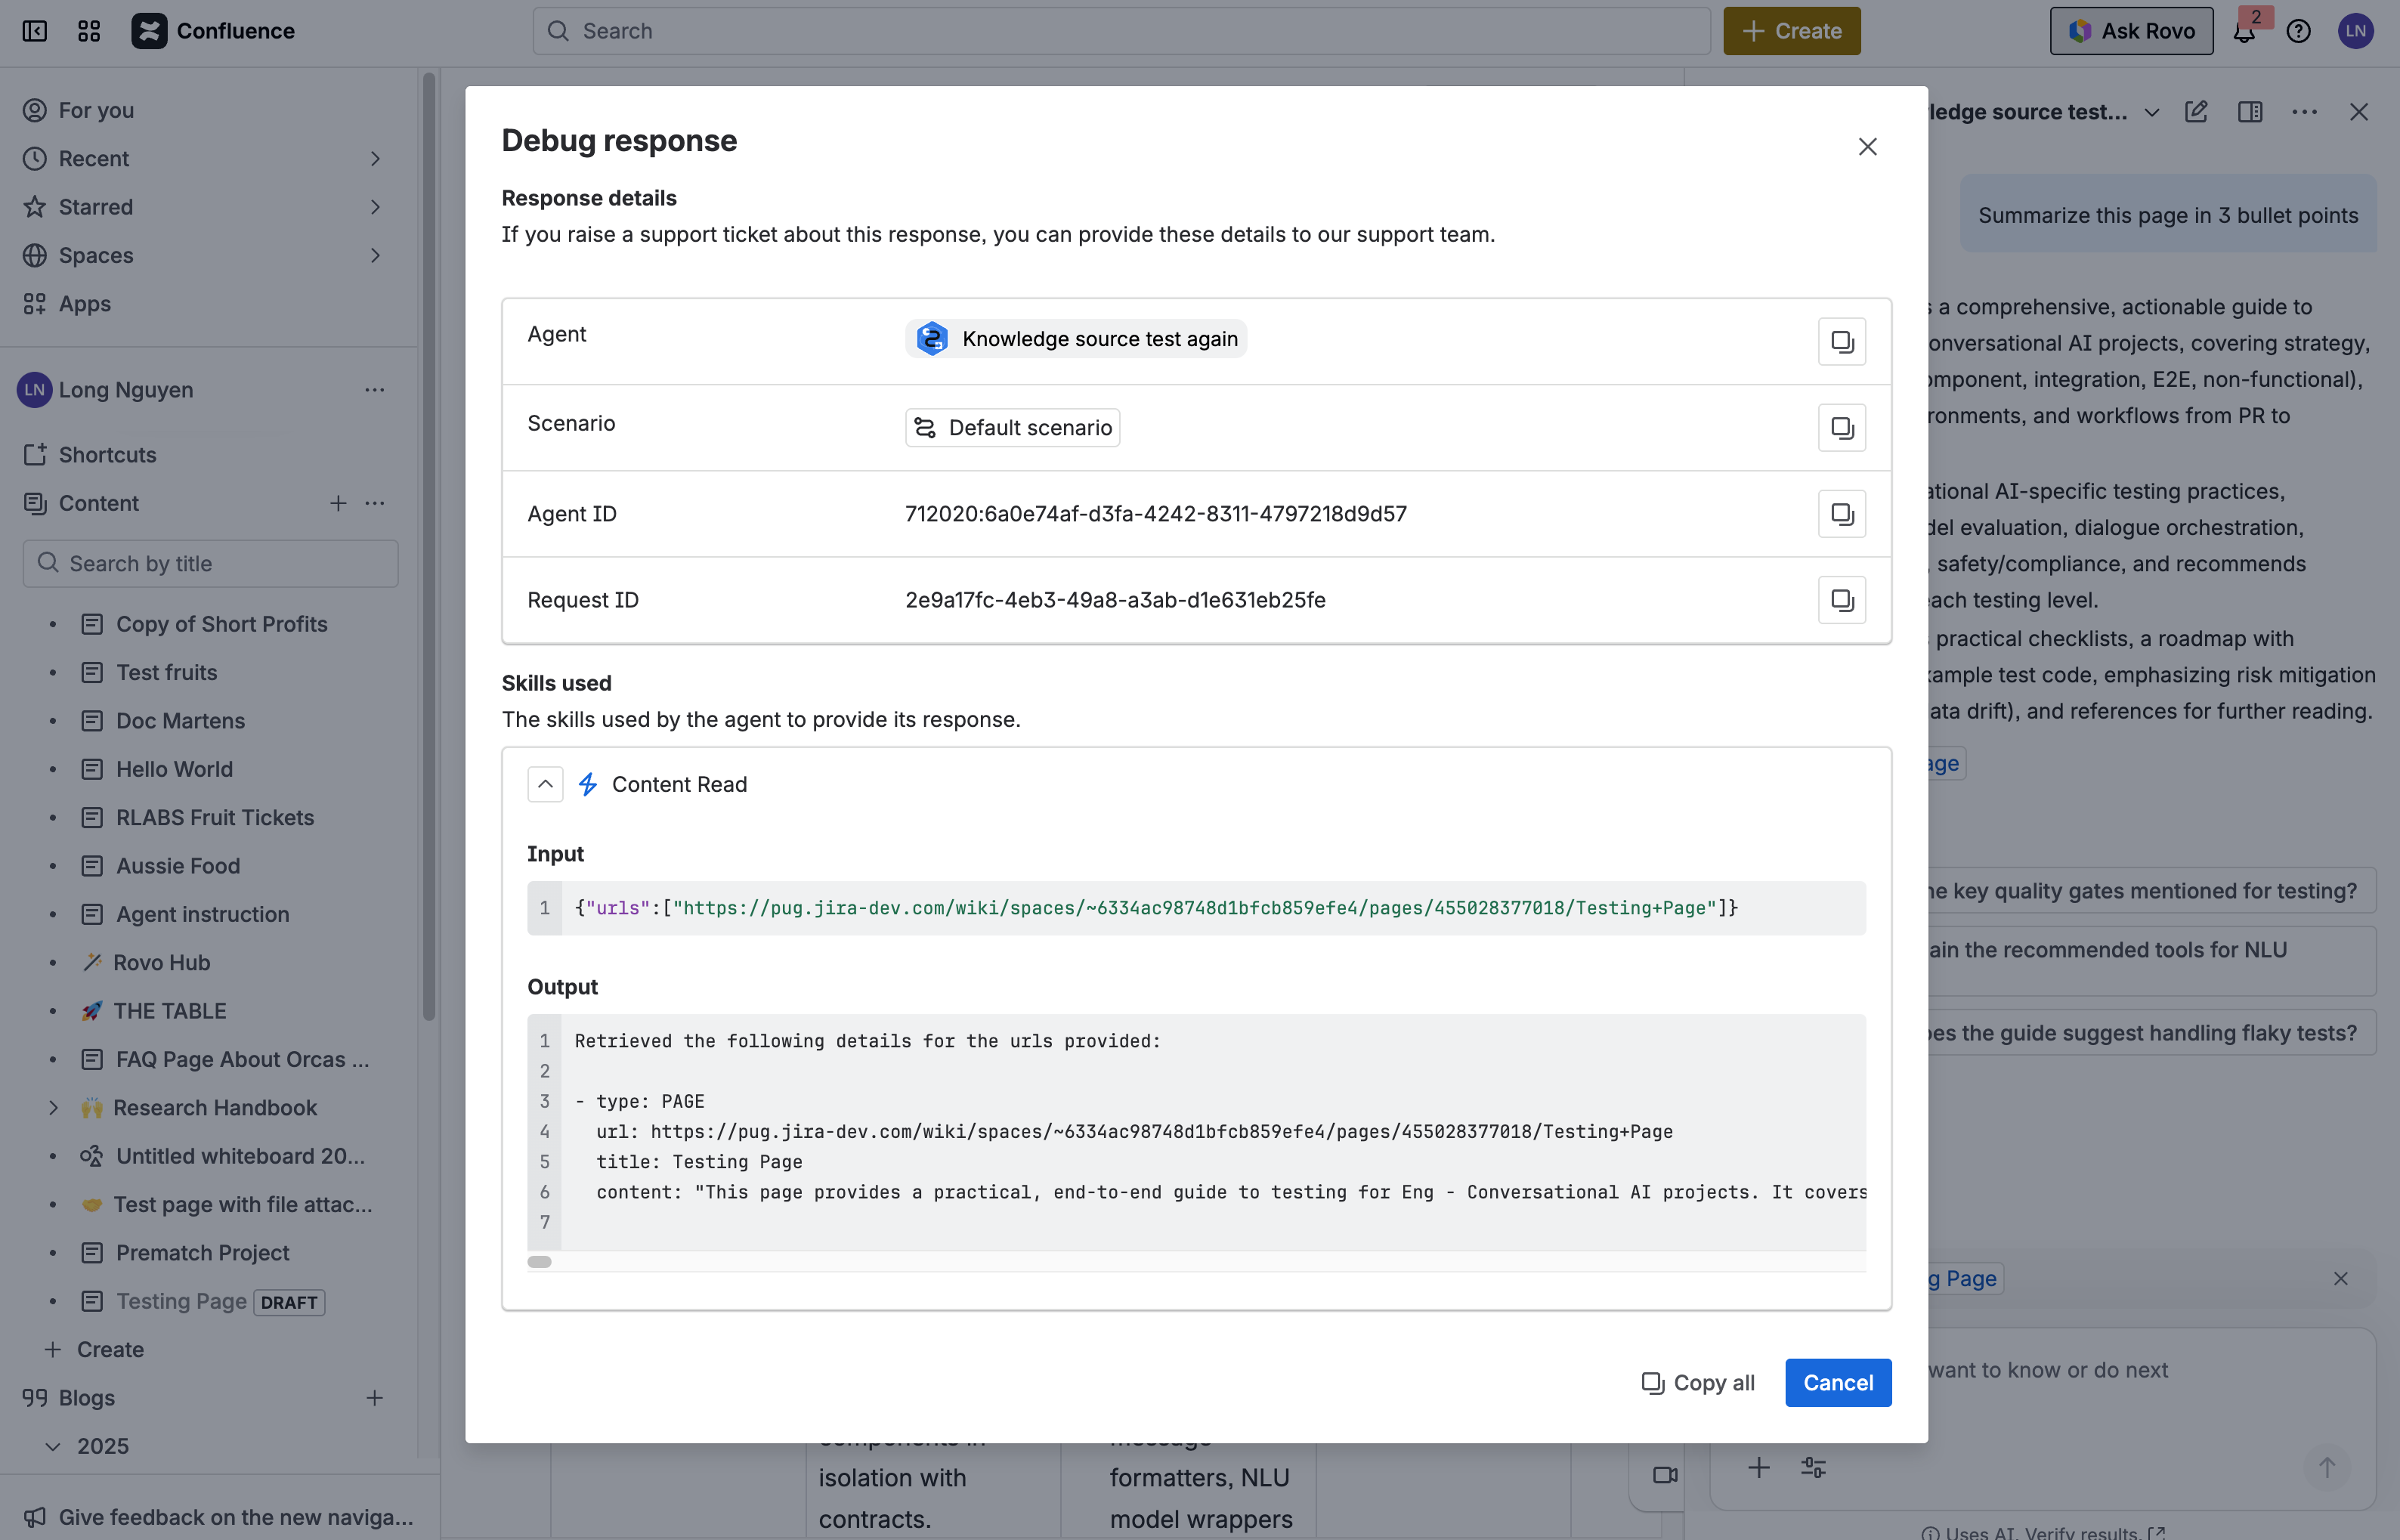
Here’s what you’ll get:
-
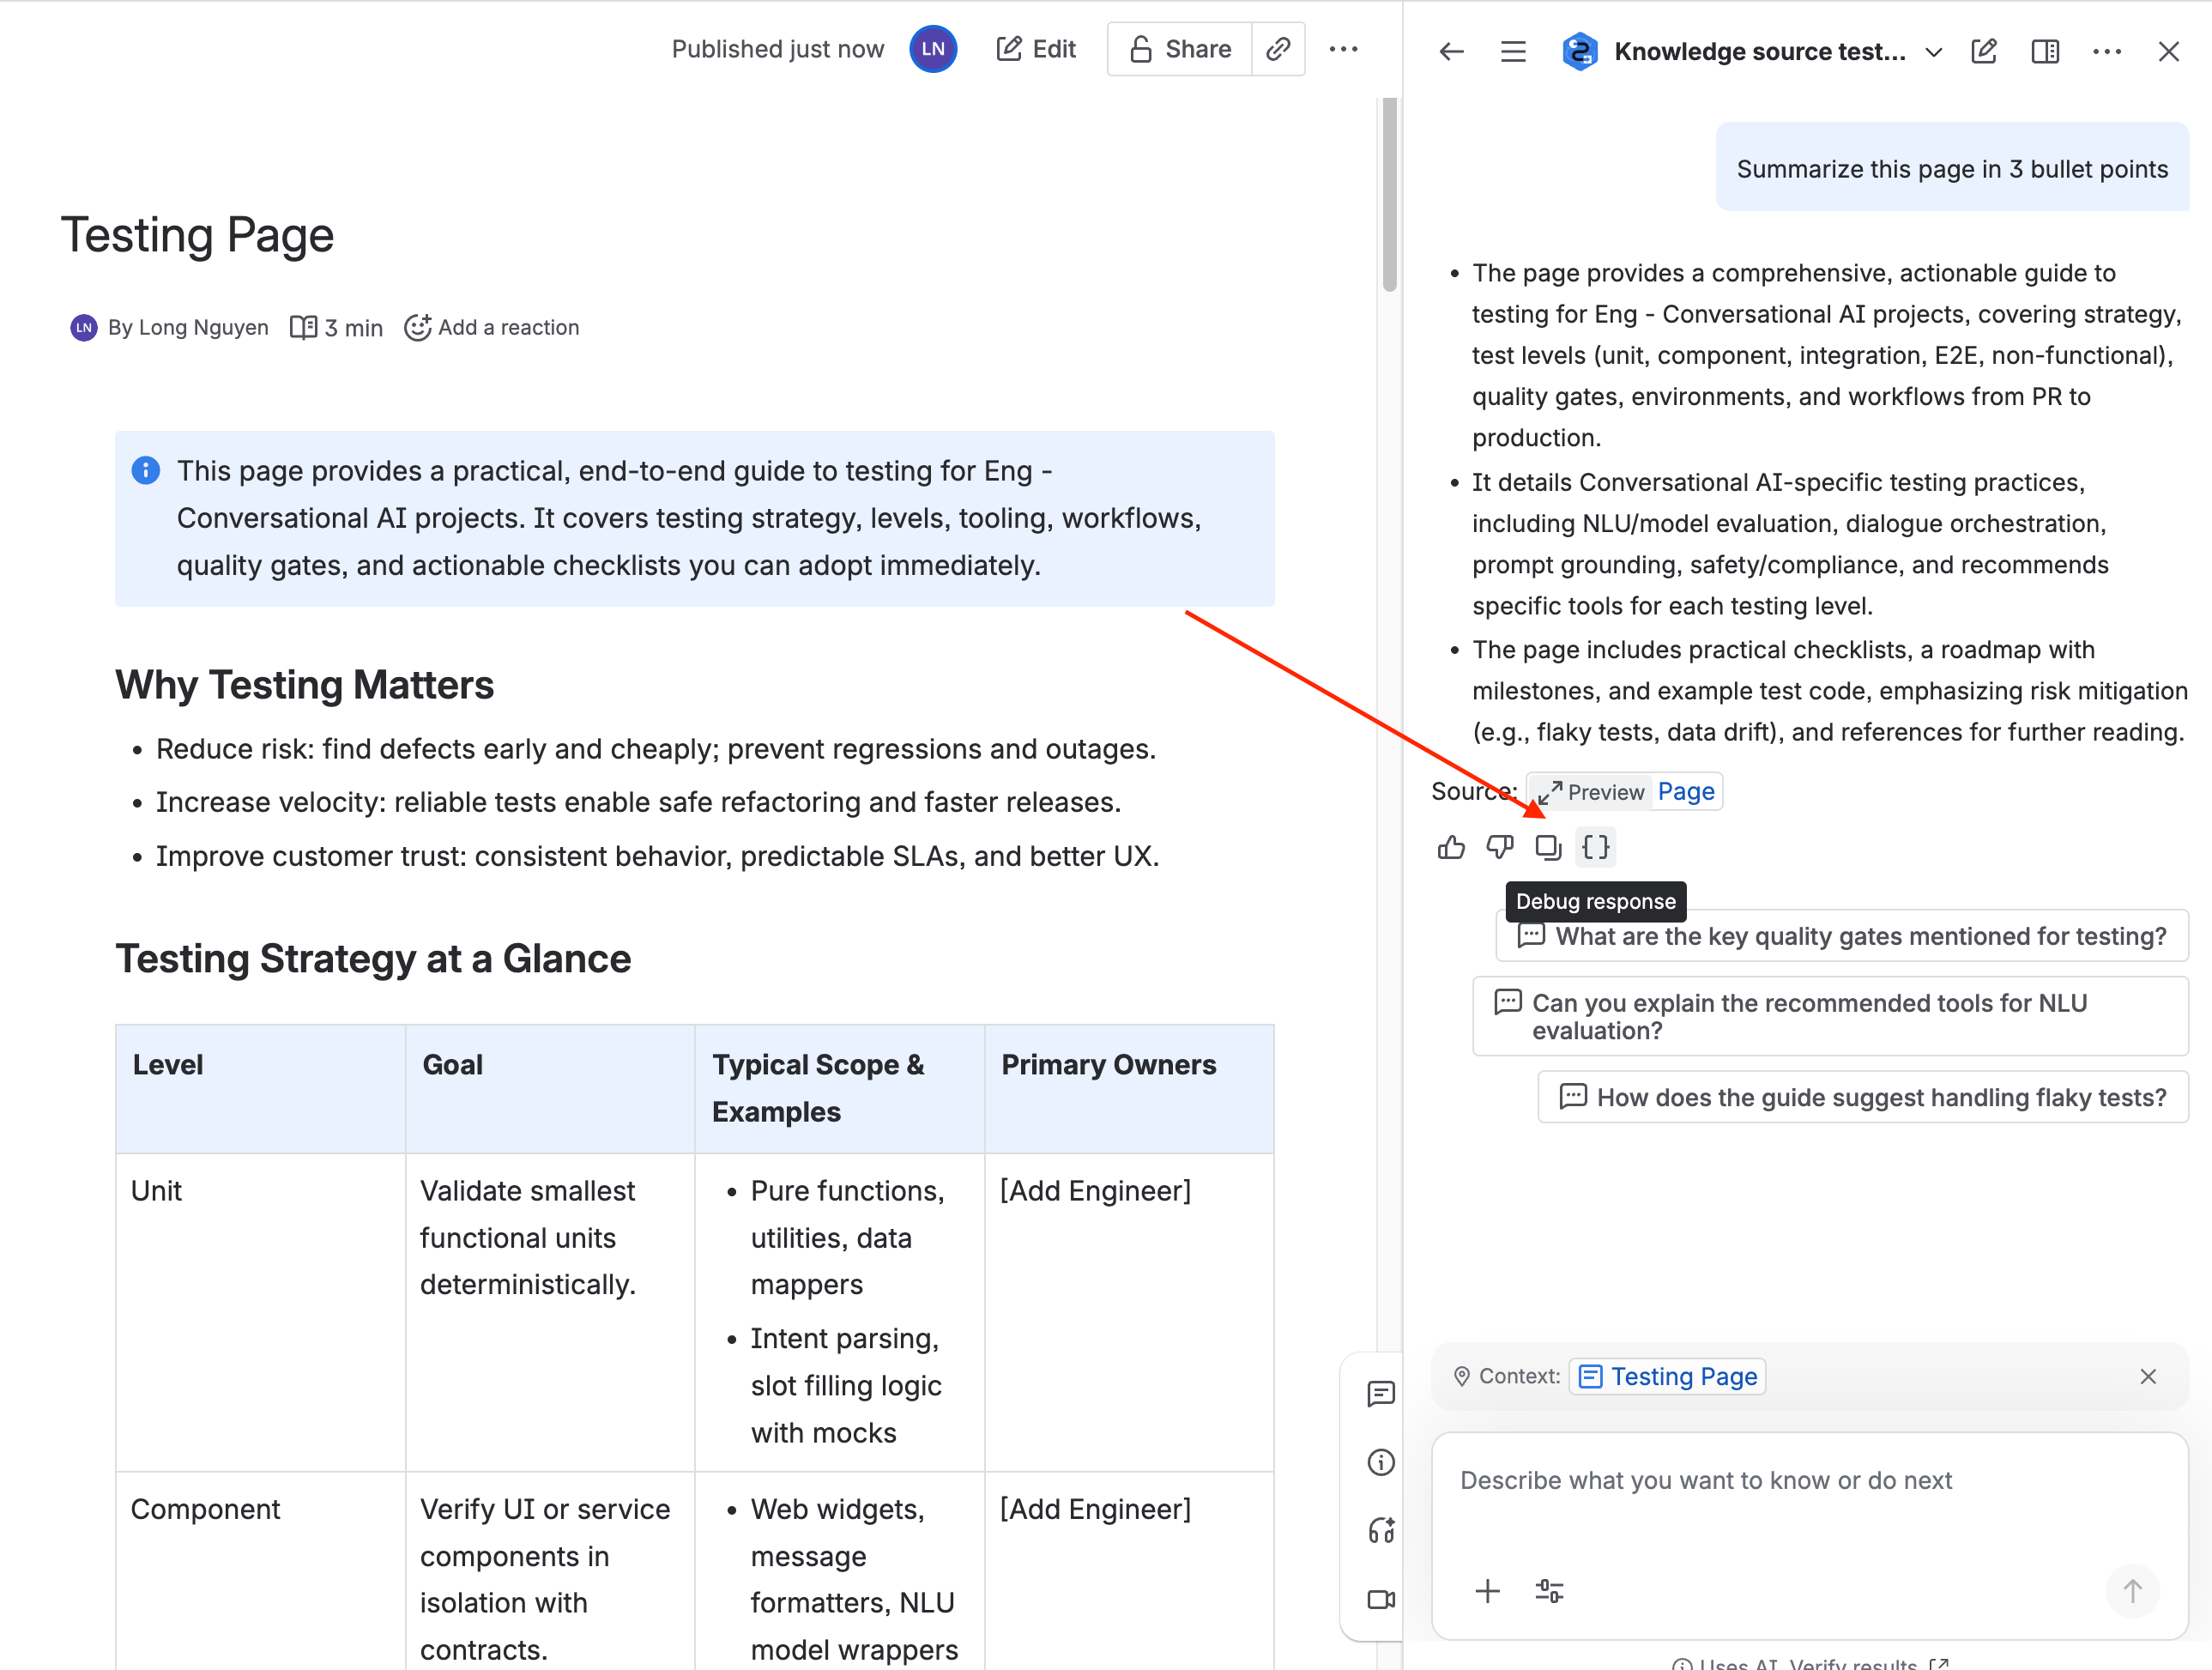
A new “Debug response” button on each agent answer in chat
-
A detailed modal showing:
-
The agent and scenario triggered
-
Request ID for tracking
-
All skills invoked (with names, inputs, and outputs)
-
One-click copy for all debug information
You can copy this information to share with your team or support—making collaboration and troubleshooting a breeze.
How to Get Started
-
Open any Rovo agent chat
-
Look for the new “Debug” button on agent answers
-
Dive into the details and start exploring!
Ready to try it?
We’re rolling this out progressively in the next couple of days—keep an eye out for the new button in your chat interface.
We Want Your Feedback!
Tried Debug? Have ideas for what you want to see next? Drop your thoughts in the comments. Your feedback helps us make Rovo Agents better!
Happy debugging!


