Managing project costs in Jira can be a challenging task. Project managers often ask:
- Are we on budget?
- Will we deliver on time?
- What will the final cost be?
Without clear data, projects risk budget overruns, missed deadlines, and frustrated stakeholders.
This is where Earned Value Management (EVM) comes in. It’s a proven project management methodology that integrates scope, schedule, and cost data to provide accurate insights into project performance. With the help of Jira apps like Time & Cost Tracker for Jira, EVM reporting becomes simple and actionable.
Common project management pain points EVM solves
"Are we going to be over budget?"
→ The Cost Performance Index (CPI) shows whether spending is aligned with expectations.
"Will we deliver on time?"
→ The Schedule Performance Index (SPI) highlights potential delays or early completions.
"What’s the final cost likely to be?"
→ The Estimate at Completion (EAC) offers a realistic forecast based on current performance.
How to generate EVM reports in Jira with Time & Cost Tracker
With Time & Cost Tracker, project managers can create cost reports and export them into an EVM Excel template for in-depth analysis.
Step 1 — Install the app.
Step 2 — Log work hours and expenses for accurate data.
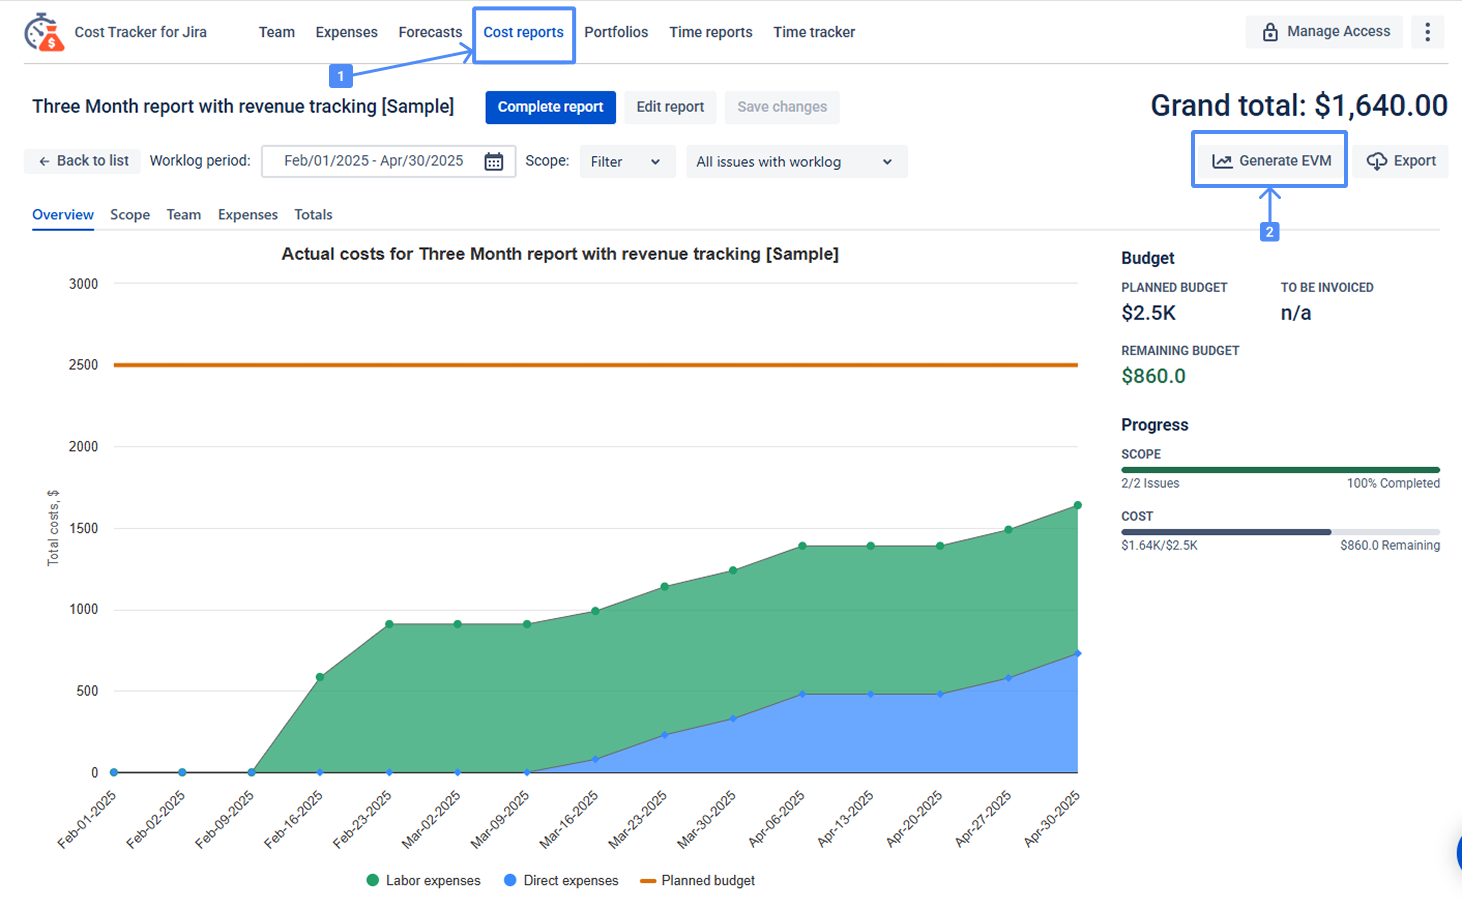
Step 3 — Generate a Cost Report
- Navigate to the Cost Reports tab.
- Click Generate EVM.
Step 3 — Open the downloaded file to analyze the EVM report.
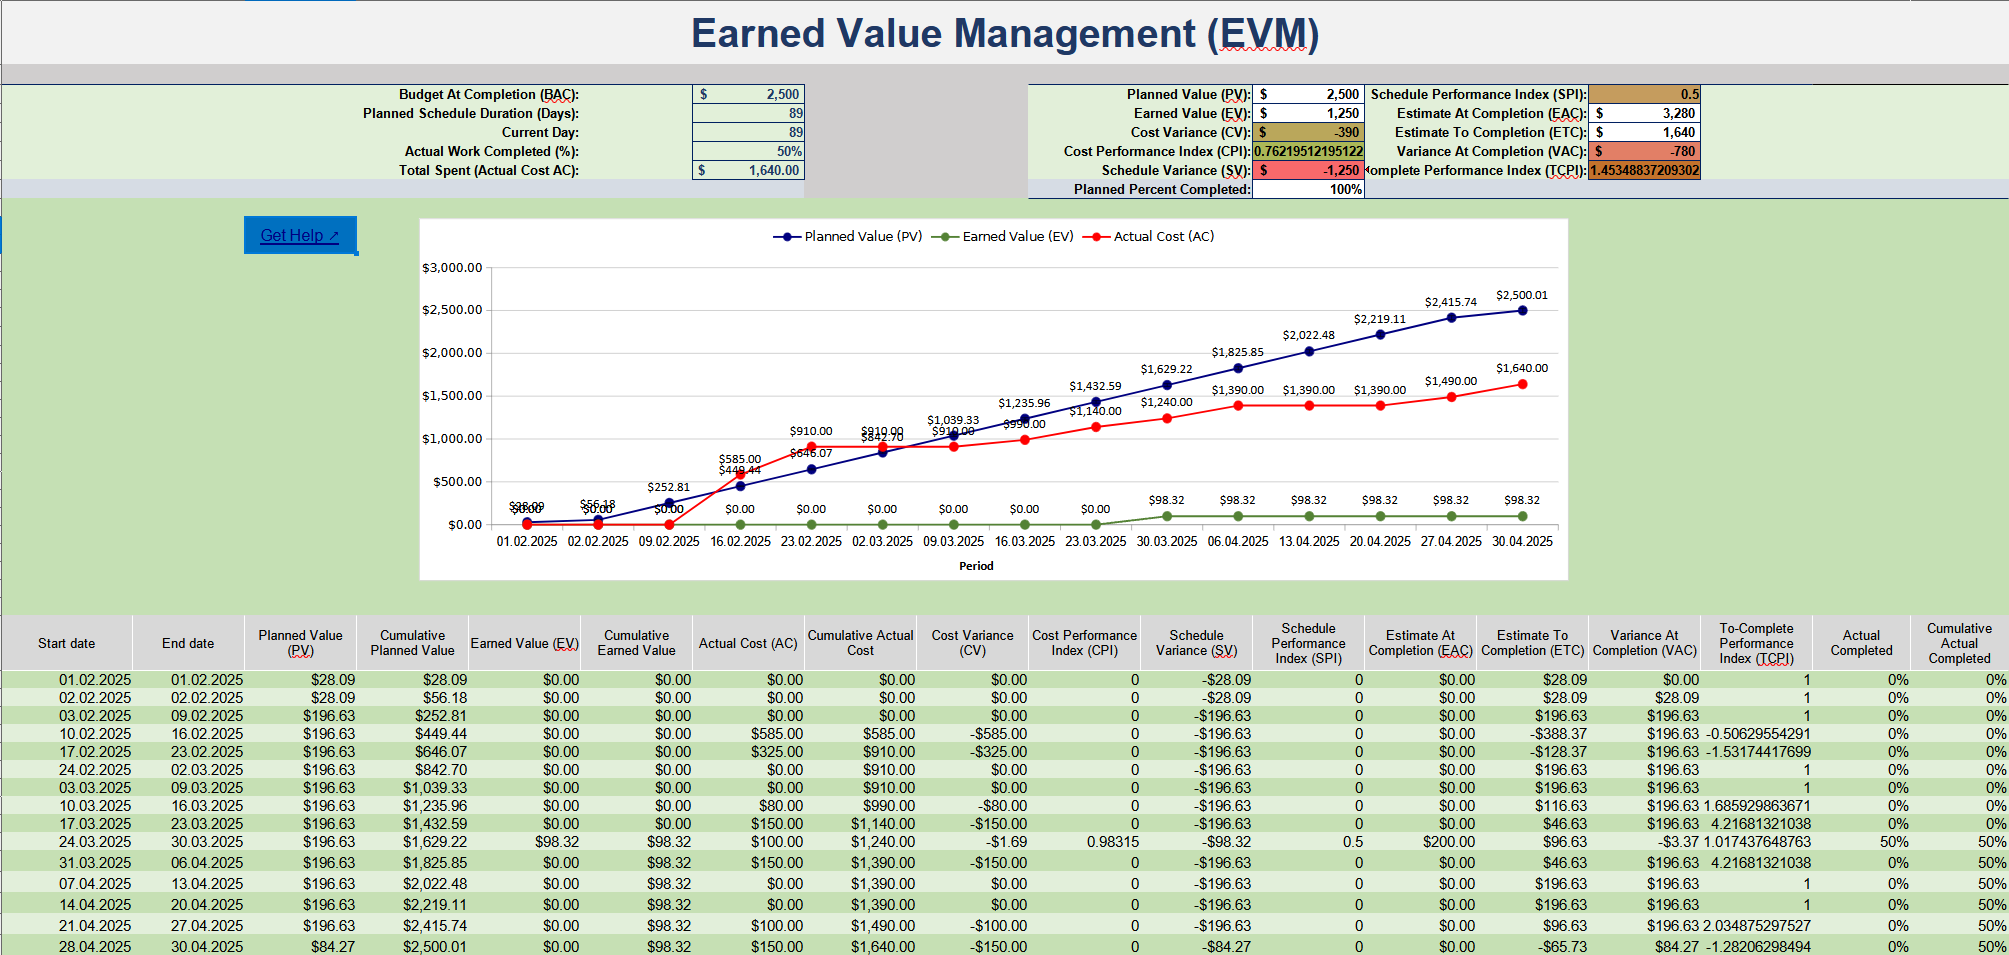
Key EVM metrics and their significance:
|
Metric
|
Meaning
|
|
Start Date & End Date
|
Defines the reporting period (e.g., week, month, quarter).
|
|
Planned Value (PV)
|
Budgeted cost of work scheduled to be completed in a specific period.
|
|
Cumulative Planned Value (CPV)
|
Sum of all PV values from the start of the project to now.
|
|
Earned Value (EV)
|
Value of work actually completed during a period.
|
|
Cumulative Earned Value (CEV)
|
Sum of all EV values to date.
|
|
Actual Cost (AC)
|
Actual money spent in a reporting period.
|
|
Cumulative Actual Cost (CAC)
|
Total AC from project start to now.
|
|
Cost Variance (CV = EV – AC)
|
Positive CV = under budget; Negative CV = over budget.
|
|
Cost Performance Index (CPI = EV ÷ AC)
|
CPI = 1 on track, > 1 under budget, < 1 over budget.
|
|
Schedule Variance (SV = EV – PV)
|
Positive SV = ahead of schedule; Negative SV = behind.
|
|
Schedule Performance Index (SPI = EV ÷ PV)
|
SPI = 1 on track, > 1 ahead, < 1 behind schedule.
|
|
Estimate at Completion (EAC)
|
Forecast of total project cost.
|
|
Estimate to Complete (ETC)
|
Remaining budget required.
|
|
Variance at Completion (VAC = Budget – EAC)
|
Difference between budget and projected final cost.
|
|
To-Complete Performance Index (TCPI)
|
Efficiency rate needed to complete on budget.
|
|
Actual Completed & Cumulative Completed
|
Tracks work completed per period and cumulatively.
|
Benefits of using EVM in Jira
✅ Early Warning System – detect overruns or delays before they escalate.
✅ Data-Driven Decisions – adjust timelines or resources with confidence.
✅ Progress Tracking – compare actual vs. planned performance.
✅ Transparent Reporting – share clear insights with stakeholders.
⚡Example: EVM in Action
Imagine a software development team running a 6-month Jira project with a budget of $120,000. After 3 months, an EVM report in Jira shows the following metrics:
-
Planned Value (PV): $60,000 → Half of the planned budget should be spent by now.
-
Earned Value (EV): $50,000 → Based on completed work, the project has only delivered $50,000 worth of value.
-
Actual Cost (AC): $65,000 → The team has already spent more than planned.
From these numbers:
-
CPI = EV ÷ AC = 50,000 ÷ 65,000 = 0.77 → Over budget
-
SPI = EV ÷ PV = 50,000 ÷ 60,000 = 0.83 → Behind schedule
📉 Interpretation
-
The project is both over budget and delayed.
-
Forecasting with EAC (Estimate at Completion) predicts final costs of about $156,000 instead of $120,000.
📈 Action Plan
With this insight, the project manager can:
-
Re-prioritize scope: Move lower-priority features to a later phase.
-
Re-allocate resources: Assign additional developers to critical tasks.
-
Negotiate deadlines with stakeholders based on realistic progress.
-
Monitor progress weekly with EVM dashboards in Jira to prevent further slippage.
✅ The result: Instead of waiting until the end to discover budget overruns, the team gets early warnings and can take corrective action in time.
Why use Time & Cost Tracker for EVM in Jira?
- Centralized time & cost tracking inside Jira.
- One-click EVM export to Excel.
- Structured financial insights without manual spreadsheets.
- Seamless Sheets integration for charts & visuals.
By combining accurate time logs, expense data, and reporting, Time & Cost Tracker makes Earned Value Management in Jira practical, fast, and actionable.
Final Thoughts
EVM transforms raw project data into actionable insights. When paired with Jira and Time & Cost Tracker, it gives project managers the tools to:
- Proactively manage costs & schedules.
- Forecast outcomes with confidence.
- Deliver transparent reports to stakeholders.
👉 If you want to stay on time and on budget, leveraging Earned Value Management in Jira with the right app could be the next step for your team.
🔍 Book a live demo
📅 Try Time & Cost Tracker for Jira Cloud on the Atlassian Marketplace
