Hi Community,
I'm facing a very strange issue with a Pie Chart gadget that behaves differently on our production and test servers, despite what appears to be an identical configuration. I'm hoping someone might have an idea what the hidden difference could be.
-
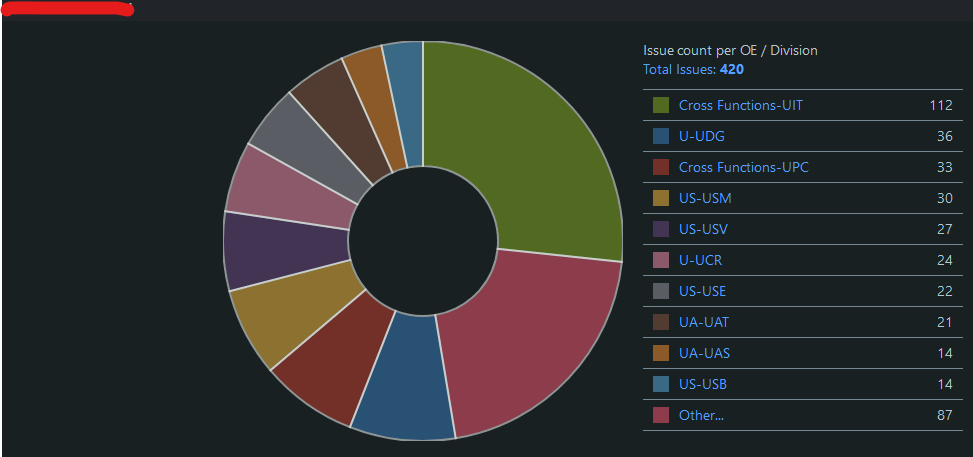
The Goal: We want to create a Pie Chart based on a saved JQL filter. The chart should be grouped by a specific custom field named 'OE / Division' using the "Statistic Type" setting in the gadget's configuration.
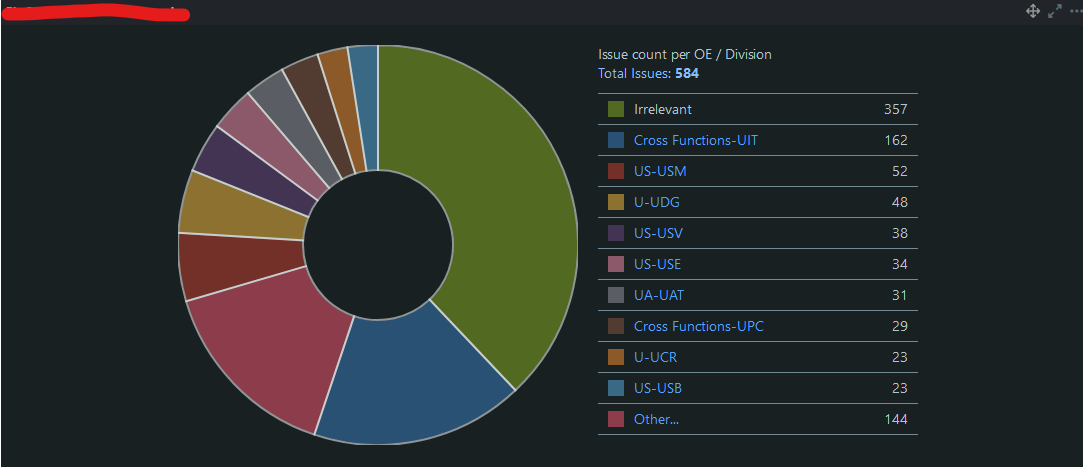
The Problem on our Production Server: The chart shows an extra bar with the name 'Irrelevant'. (screenshot below*) And the bar on testsystem is not showing --> thats how it's supposed to look.
This is the jql query:
project = DEM AND issuetype = Demand AND status in (Backlog, Planning, Analysis, Deployment, "In Definition", Refinement, Conception, Realization) ORDER BY id ASC
After uploading a pie chart and clicking on total issues the query changes automatically to this one and it says: Error in the JQL Query: A field name cannot be empty. (line 1, character 156)
project = DEM AND issuetype = Demand AND status in (Backlog, Planning, Analysis, Deployment, "In Definition", Refinement, Conception, Realization) AND NOT "" is EMPTY ORDER BY id ASC
The custom field shows the following information: “This custom field stores its data in a non-standard way, that's why we can't show accurate data about its values or issues using it.”
(same info text on test and production system)

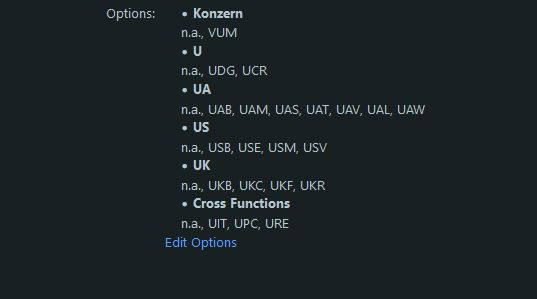
this is the Select List (cascading) custom field config with some options:
The Mystery on our Test Server: Here's the strange part: Our test server is a clone of our production environment. We replicated the exact same setup there:
-
The custom field 'OE / Division' shows the same "non-standard" warning in the admin backend.
-
The JQL filter in the gadget's configuration also shows the same syntax error warning.
-
However, on the test server, the Pie Chart gadget renders correctly and displays the data exactly as we need it!
What We've Checked So Far:
Jira & App Versions and Gadget & Filter Configuration
*Screenshots:
It should look like this (this is our testsystem)
But it looks like this (this is the production system)
Any ideas or suggestions on what to investigate next would be greatly appreciated!
Thank you!

