In enterprise DevOps environments, it's not enough for teams to simply move fast. Speed without visibility often leads to missed expectations, bottlenecks, and technical debt that quietly grows in the background. For senior leaders driving cloud enablement or application management at scale, the real challenge lies in connecting the dots between engineering workflows and strategic business goals.
Jira Data Center is the operational backbone for many such organizations. It tracks the work, manages the flow, and serves as a central source of truth. However, while Jira informs you of what happened and when, it doesn’t always explain why work gets delayed or where process friction is occurring.
That’s where Time in Status for Jira Data Center becomes an essential part of the DevOps toolkit.

The Disconnect Between DevOps Activity and Business Insight
Even in high-functioning enterprise teams, it's common to see a gap between engineering data and executive visibility. You may know that a deployment was delayed, but not realize that 60% of tasks in that release spent more than two days in "Ready for QA" due to internal dependencies.
Leaders don’t need more granular tickets. They need macro-level trends and time-based insights:
- How long do tasks stay in each part of our workflow?
- Where are work items getting stuck across releases?
- Which teams or projects are driving the most rework?
- Are we improving or repeating the same delivery patterns?
These are not just reporting questions. They're strategy questions. And Time in Status helps answer them.
Turning Workflow Data Into Strategic Decisions
Time in Status for Jira Data Center transforms transition logs and work item history into clear, filterable, and exportable time-based reports. Here’s how enterprise leaders use it to align execution with goals:
🔄 Improve Cycle Time and Delivery Reliability
Use Time in Status Report and Average Time Report to track how long work items spend in each workflow stage.
This helps identify systemic delays—not just in "In Progress," but in handoff statuses like "Code Review," "Waiting for QA," or "Blocked." Reducing time spent in these stages boosts predictability and improves team velocity without requiring heroic efforts.
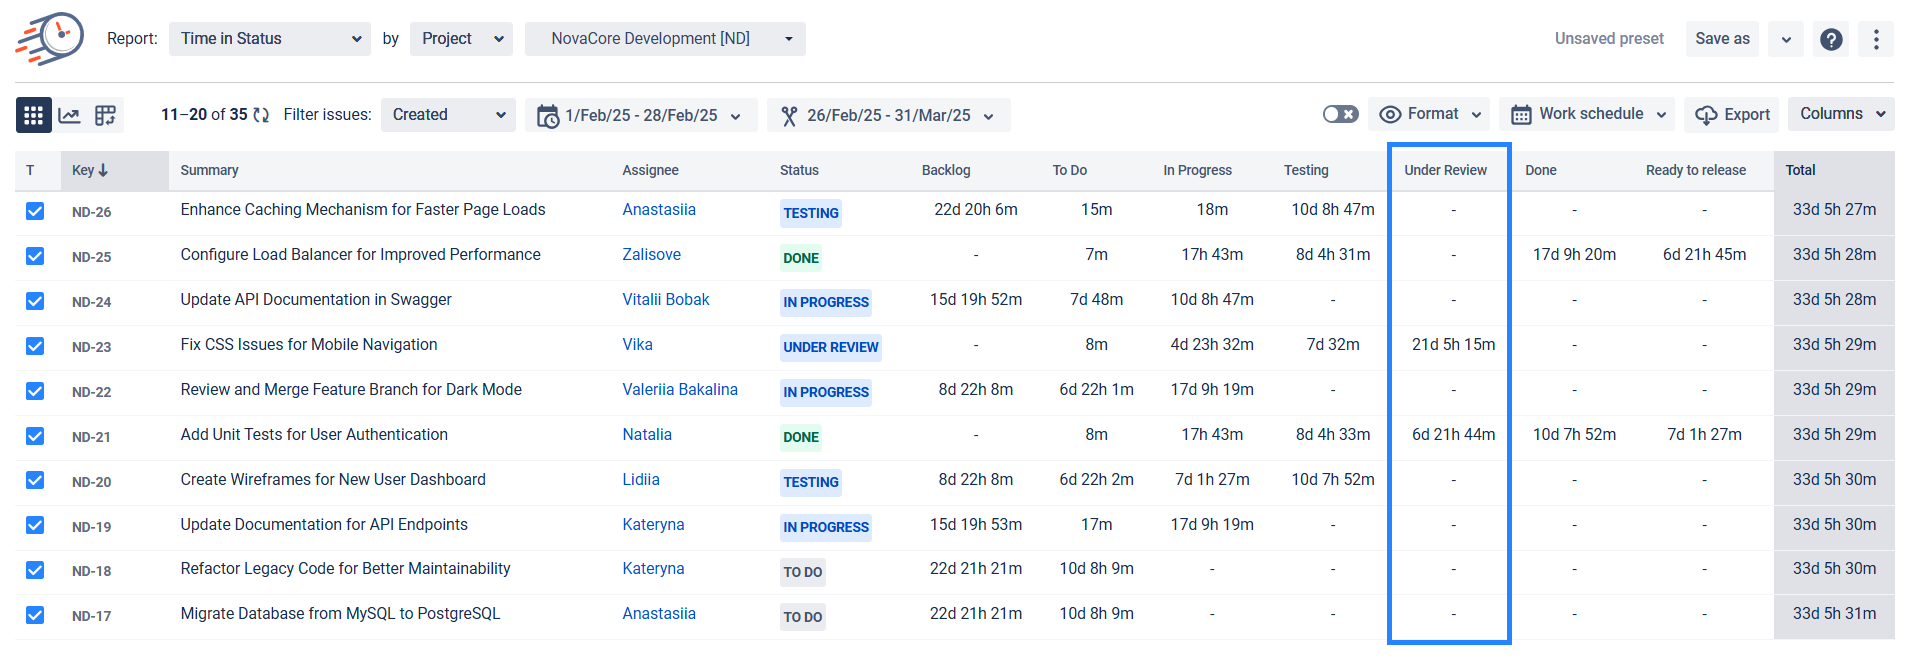
Time in Status Report
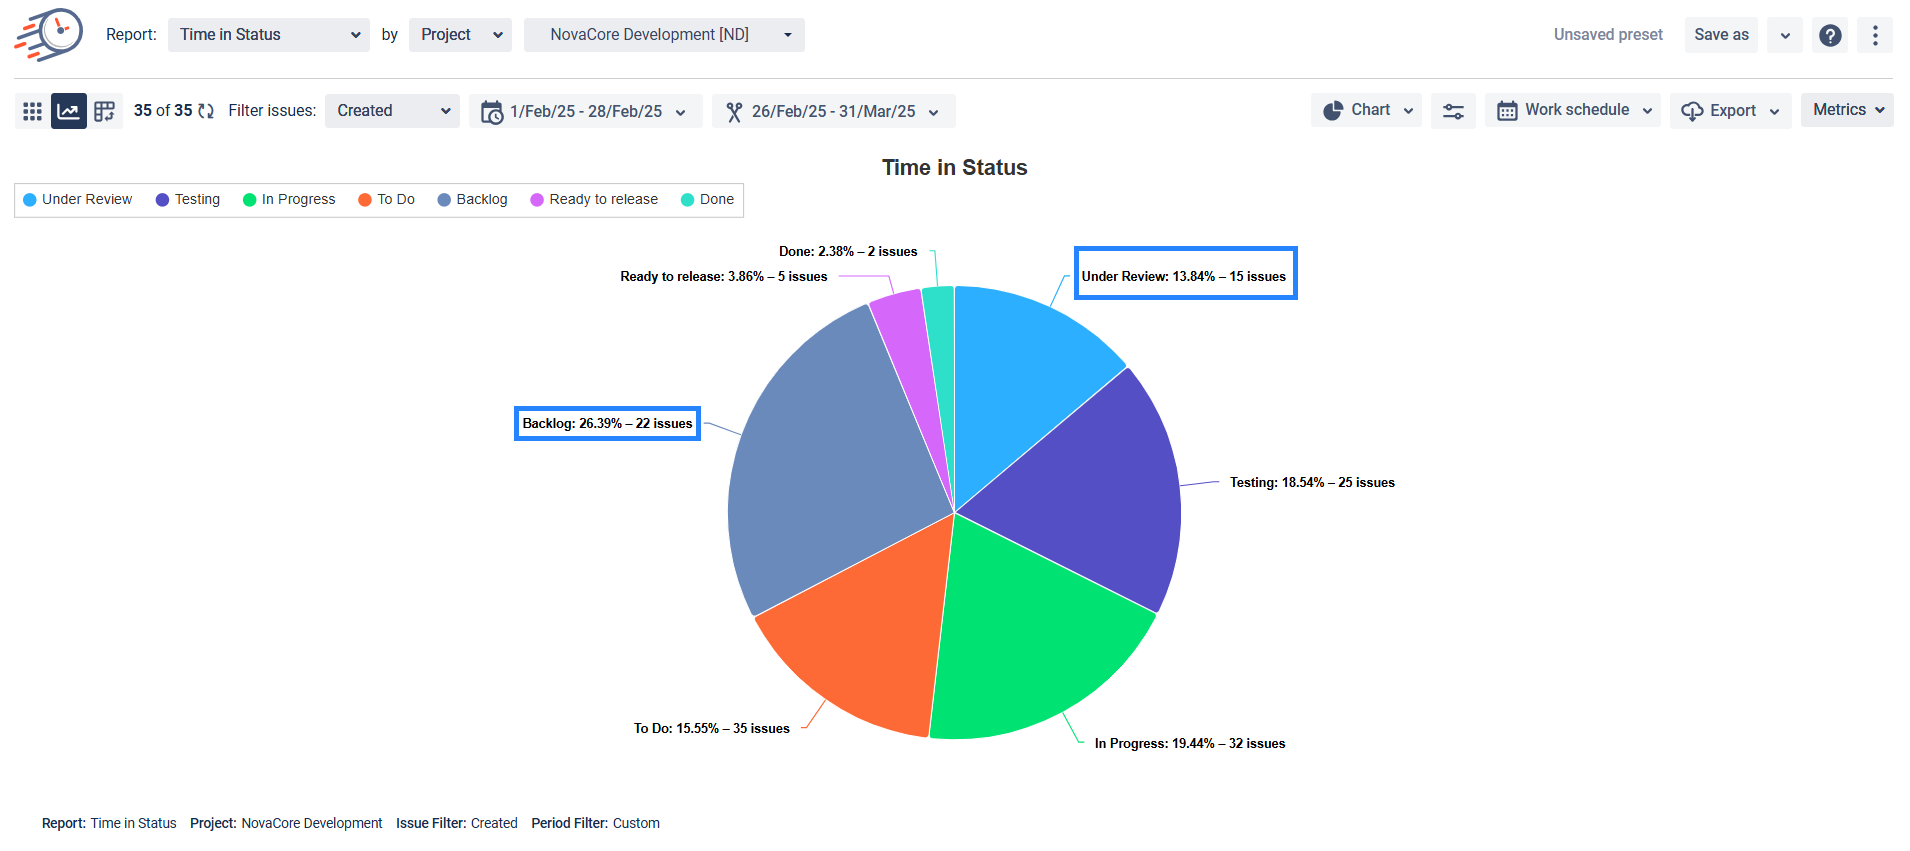
Time in Status Report - Pie Chart
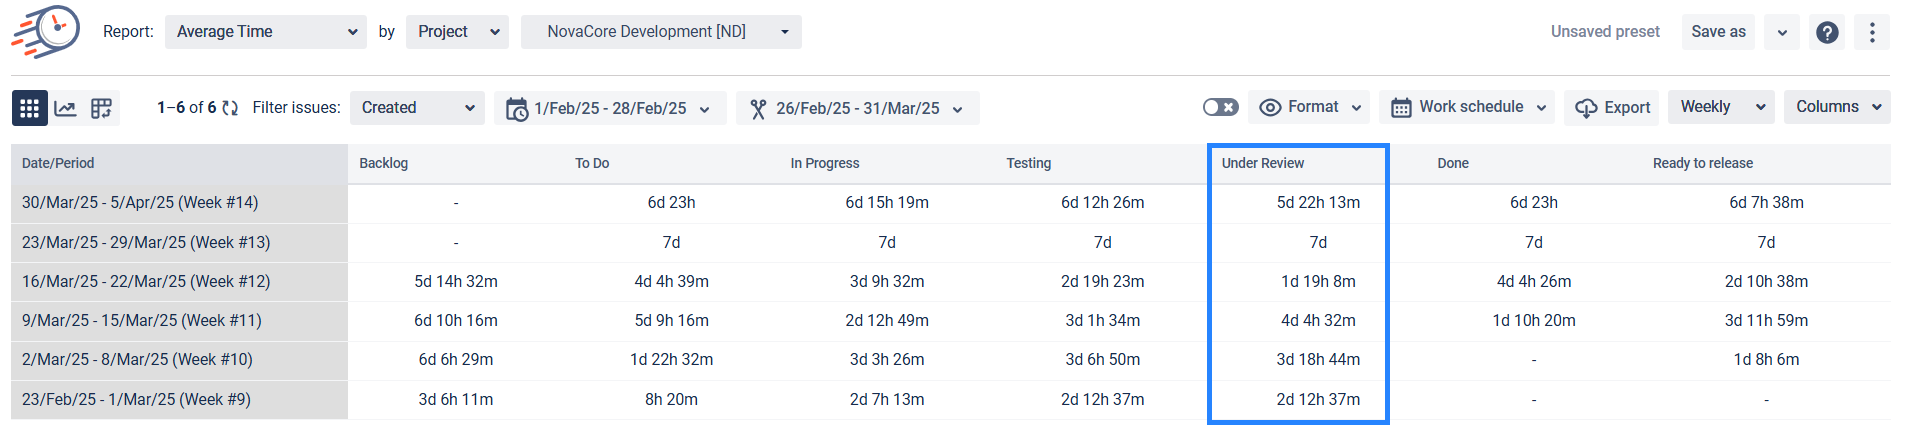
Average Time Report
🚑 Reduce Rework and Surface Process Friction
The Status Count Report and Transition Count Report make it easy to identify work items that loop repeatedly between the same statuses (e.g., Dev → QA → Dev).
This is a red flag for unclear requirements, unstable environments, or testing failures. Leaders utilize these patterns to coach teams, refine the definition of "done," and enhance cross-team collaboration.

Status Count Report
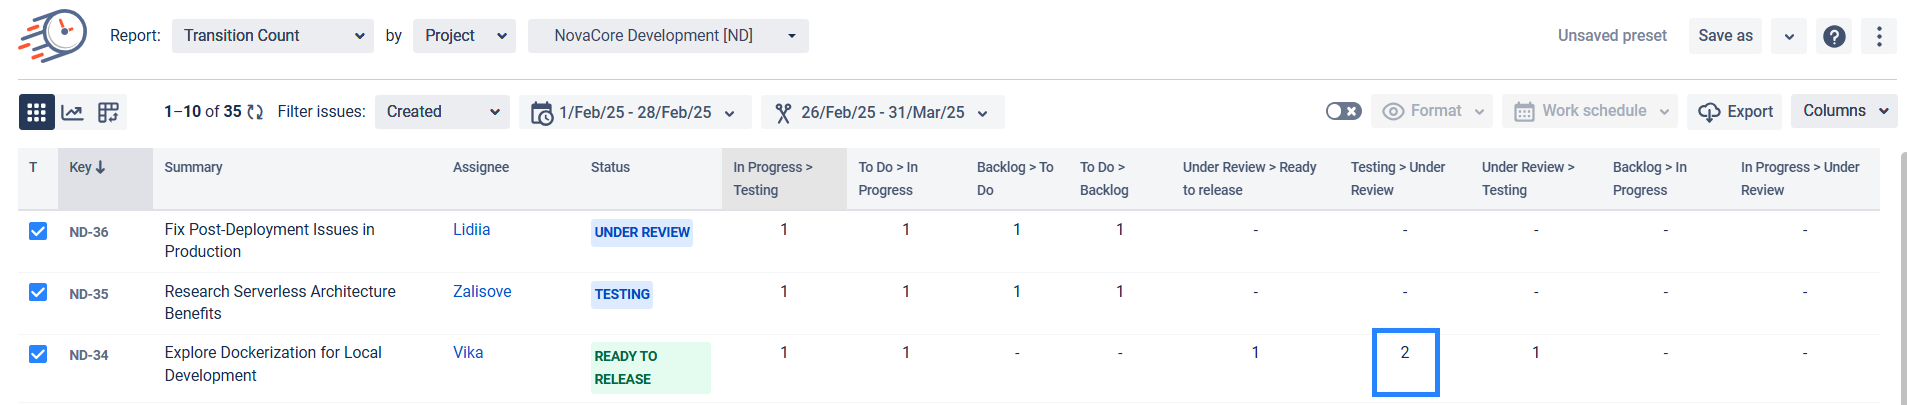
Transition Count Report
🤝 Optimize Team Utilization Without Micromanaging
The Assignee Time Report displays the amount of time each team member spends on work items. Instead of guessing who’s overloaded, you can see it.
Pair this with the Pivot Table View to roll up reports by team, epic, or sprint. This helps managers reallocate resources where they're most needed or flag areas that need extra support.
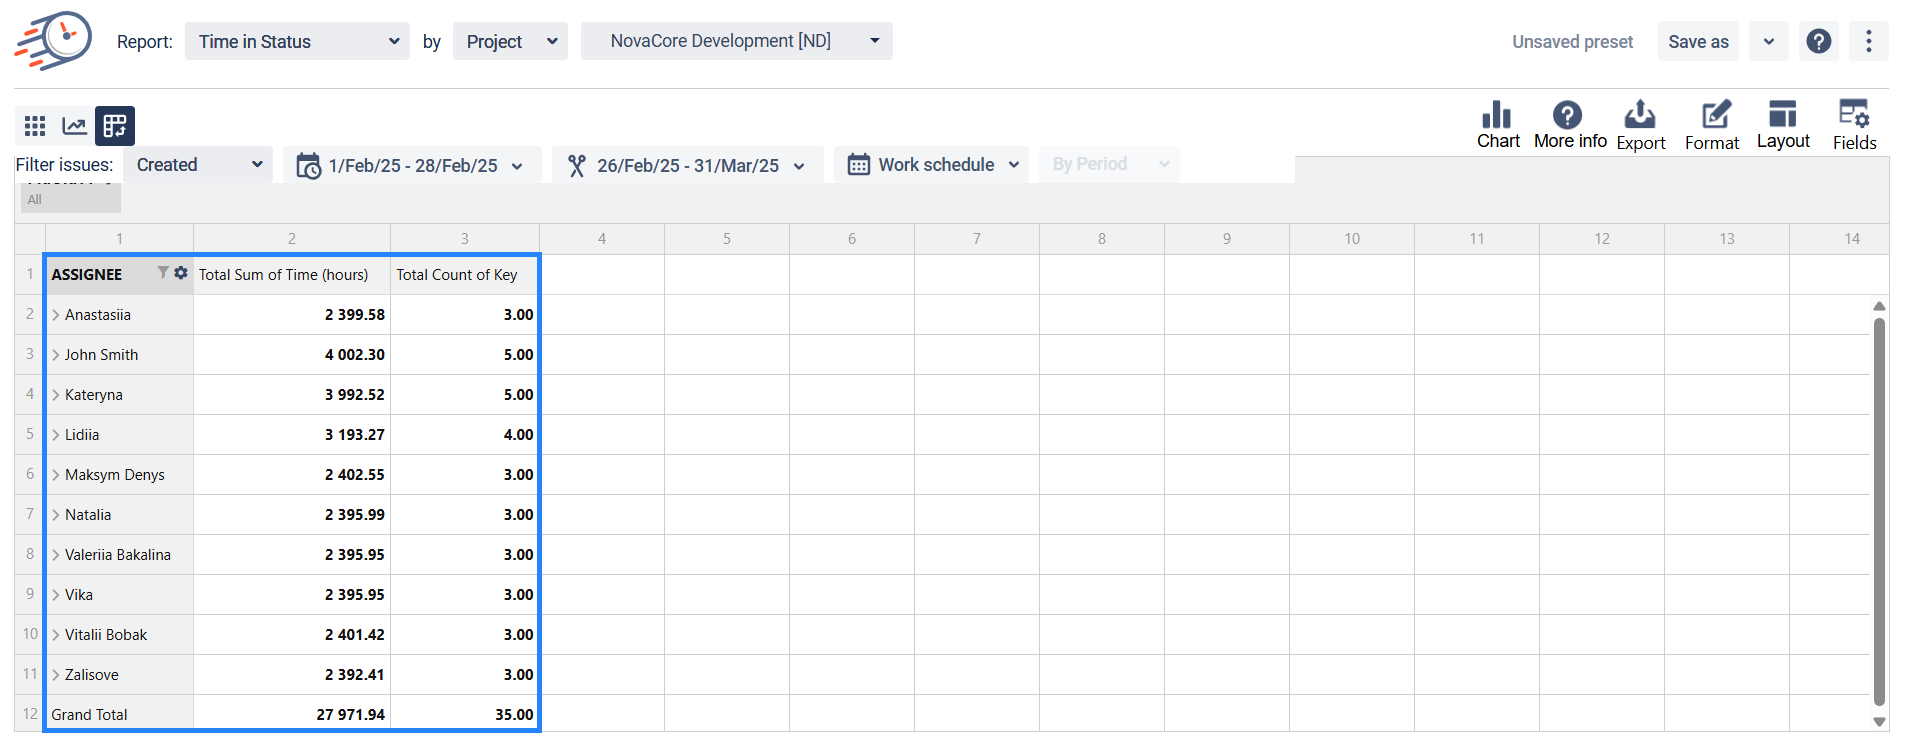
Pivot Table View
⏲️ Track Improvement Over Time
Historical trends matter. The Time in Status per Date Report helps you see how metrics evolve from one sprint to the next.
Is your average time in "Waiting for Review" decreasing? Are blockers becoming less frequent? This report turns process improvement from a gut feeling into measurable progress.
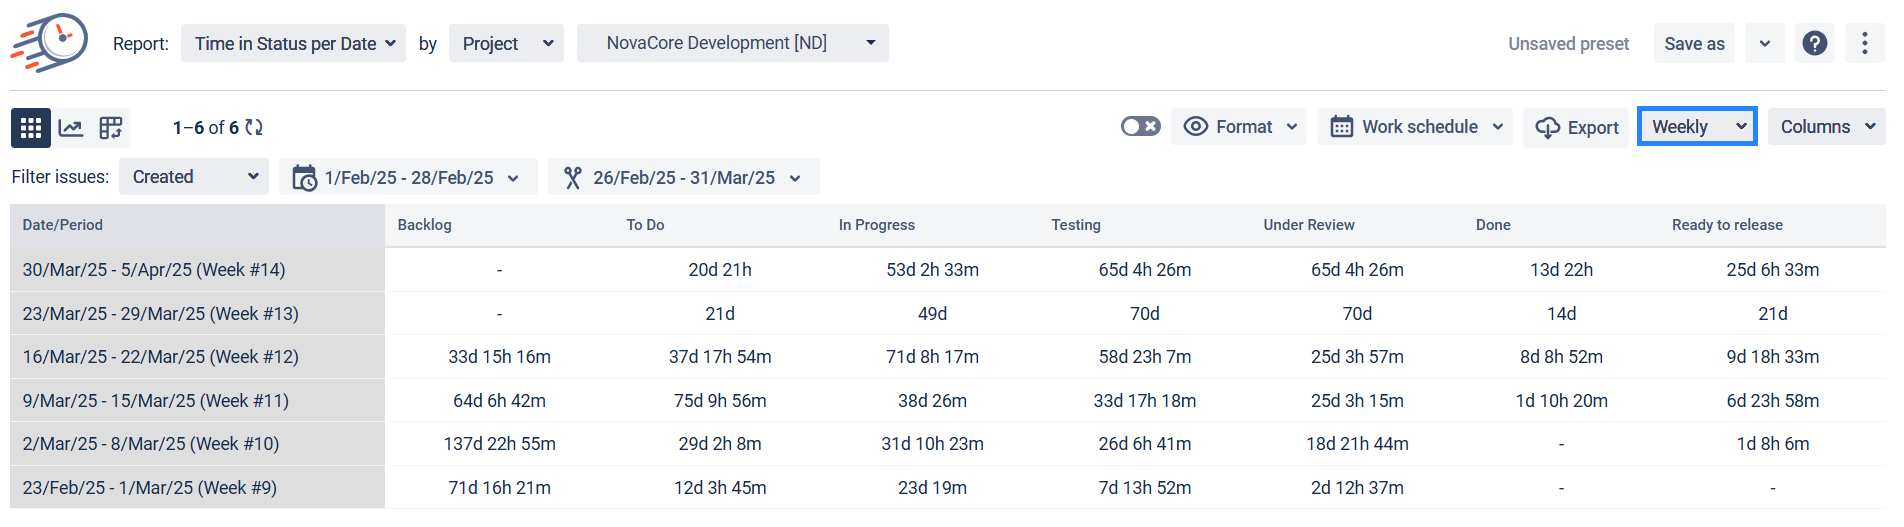
Time in Status per Date Report
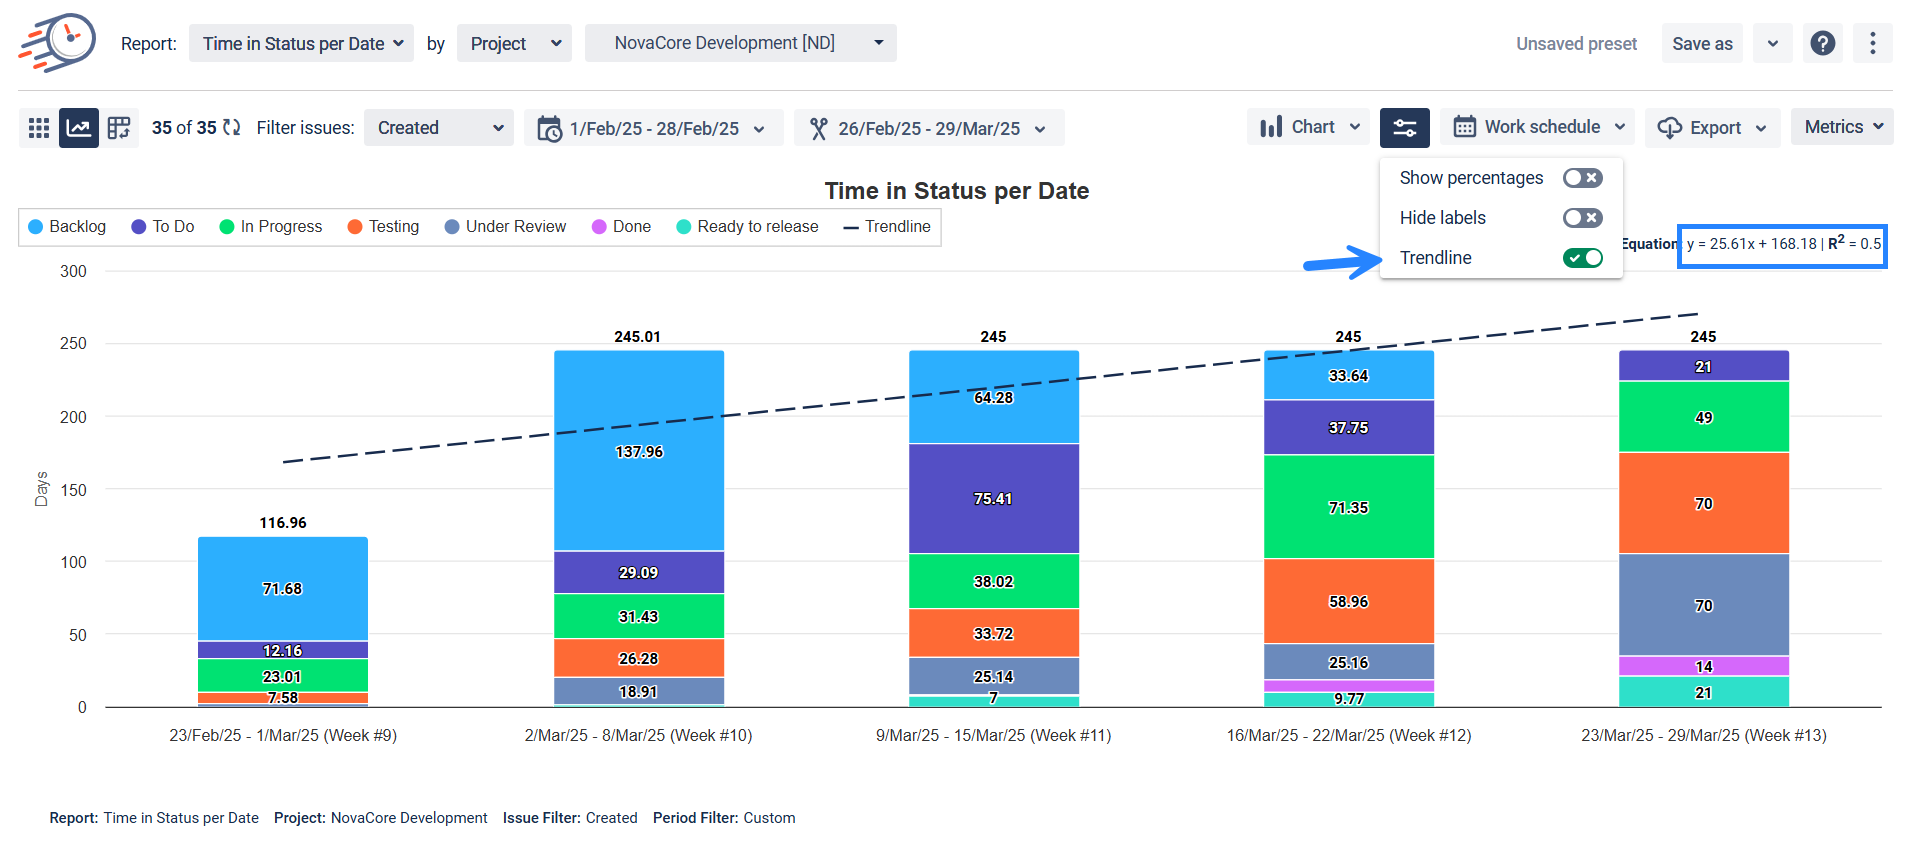
Time in Status per Date Column Chart with Trendline
Why It Works for Enterprise, On-Premise Teams
Time in Status is built for Jira Data Center, which means it respects the performance, security, and scale needs of large self-hosted environments:
- On-premise control: All data stays behind your firewall.
- No workflow changes required: Just install and start reporting.
- Handles enterprise scale: Built for large work item volumes and complex team structures.
From Visibility to Strategy
As a leader, you don’t need to monitor every story or subtask. But you do need to understand:
- Where delivery is slowing down
- Whether process improvements are working
- How team effort aligns with business priorities
Time in Status for Jira Data Center* provides visibility without adding overhead for your teams. It’s not just a reporting tool — it’s a strategic lens for better decisions.
If you're ready to translate Jira activity into DevOps clarity, it's worth exploring what Time in Status can reveal.
*App available also for Jira Cloud: Link for Time in Status
