Endless filters, dashboards that need tweaking, or exporting to Excel just to build the same monthly report again...
Even though the data already lives in Jira, getting it into a usable report often becomes a side project of its own. Many teams still rely on one or two "Jira experts" to build or maintain dashboards, or spend hours manually assembling views to answer the same questions every sprint.
I believe - reporting should be something anyone can do-quickly, independently, and with confidence.

There’s a big difference between “having data in Jira” and actually being able to use it. Most teams don’t need fancy BI tools-they just need quick answers to everyday questions. And it turns out, many of those reports can be created by anyone on the team, without waiting for an admin, analyst, or dashboard wizard.
This shift matters more than it seems. When reporting becomes self-service, it:
And it boosts confidence. When people can access metrics themselves, they trust the results more-and use them.
Top 5 Reports You Shouldn’t Be Clicking More Than Couple Times
Some reports seem too advanced to be self-service-but in practice, they’re the ones every team should be able to pull up instantly. Here are five examples, each with what they show, why they matter, and how they can be accessed in just a couple of clicks.
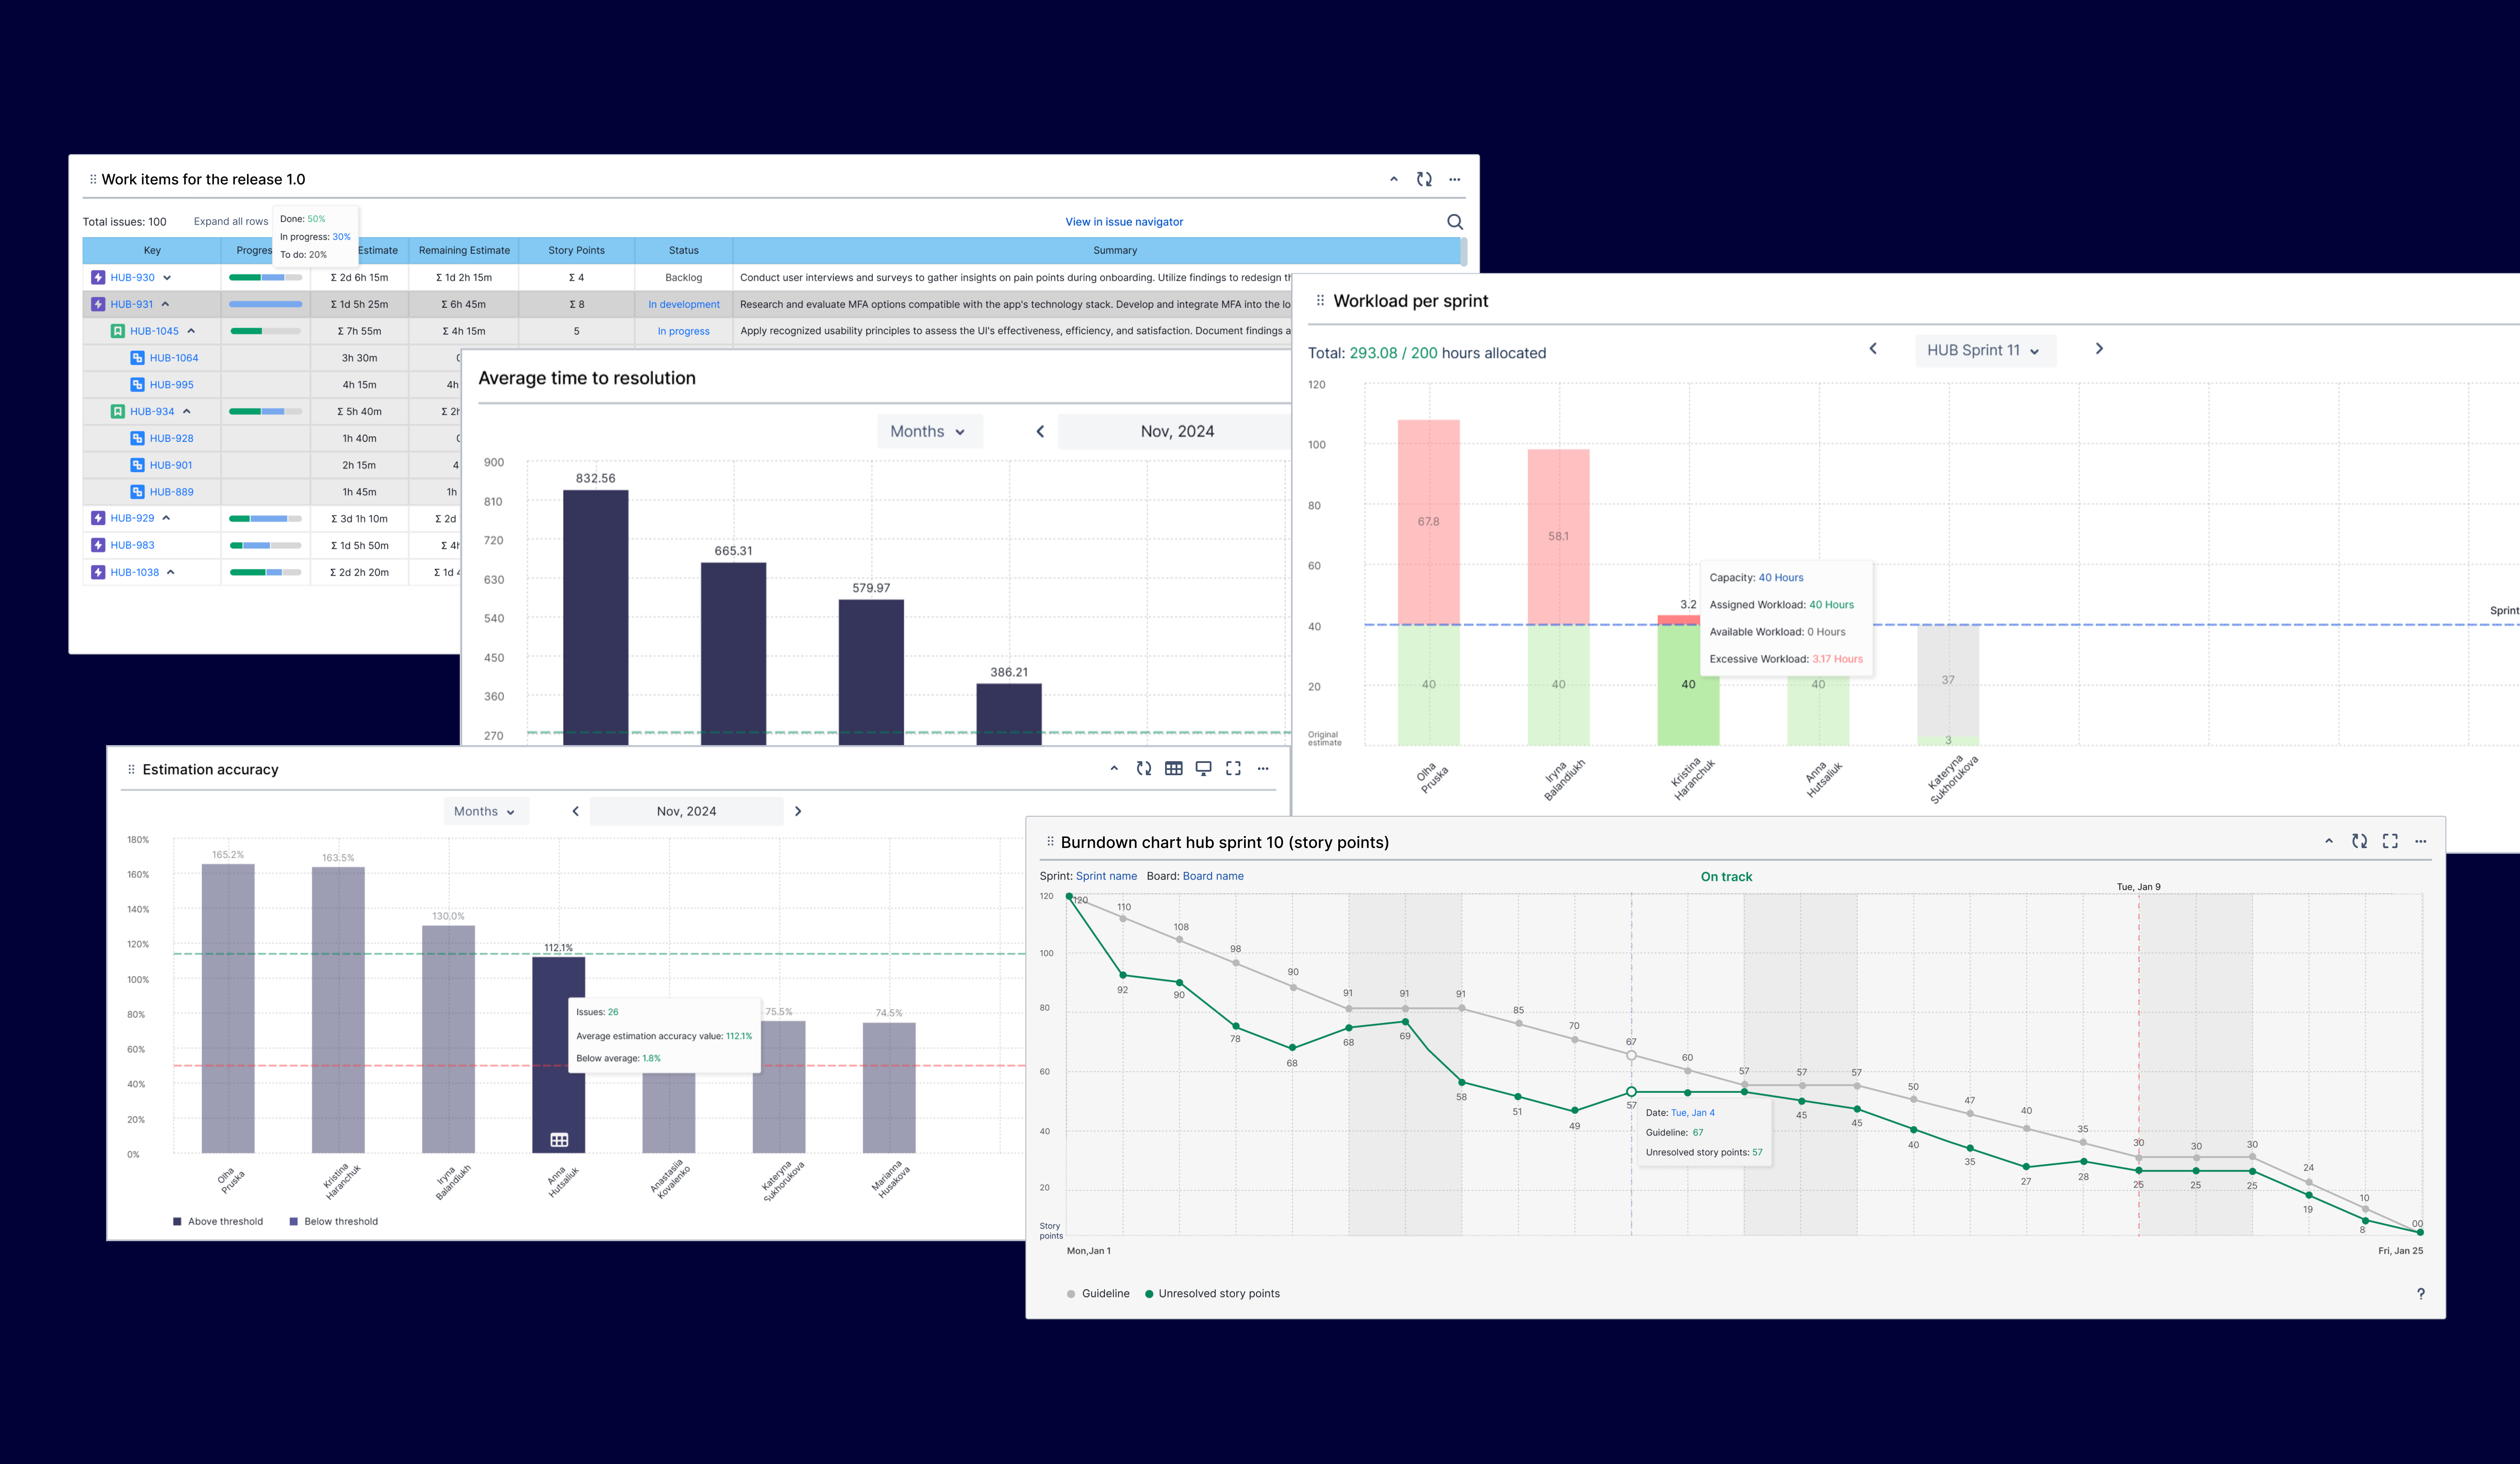
1. Average Time to Resolution
What it tells you: The average time it takes to resolve issues from creation to closure.
Why it matters: Provides a high-level view of how efficiently work moves through the team, and can reveal trends in delivery or customer support responsiveness.
2. Estimation Accuracy
What it tells you: The gap between estimates and actual delivery.
Why it matters: Sheds light on planning reliability and room for improvement.
3. Workload Distribution
What it tells you: How tasks are allocated across the team.
Why it matters: Helps balance the team’s workload and plan sprints in a way that maximizes the chances of completing everything that’s been committed.
4. Sprint Progress
What it tells you: Task completion rate during the sprint.
Why it matters: Lets you intervene early if delivery is at risk.
5. Work Breakdown Structure (Rollup)
What it tells you: The hierarchy of epics, stories, and tasks in context.
Why it matters: Helps teams see structure, status, and blockers in one view.
All of these reports can be pulled up without filters, no custom dashboards, and no Jira admin requests-thanks to prebuilt templates inside Report Hub.
How to Do It
If you’re using Report Hub, you don’t need to write a code or understand how the report works behind the scenes. The interface is intuitive, and the reports are designed to be self-explanatory-so anyone can find what they need without having to learn Jira reporting logic.
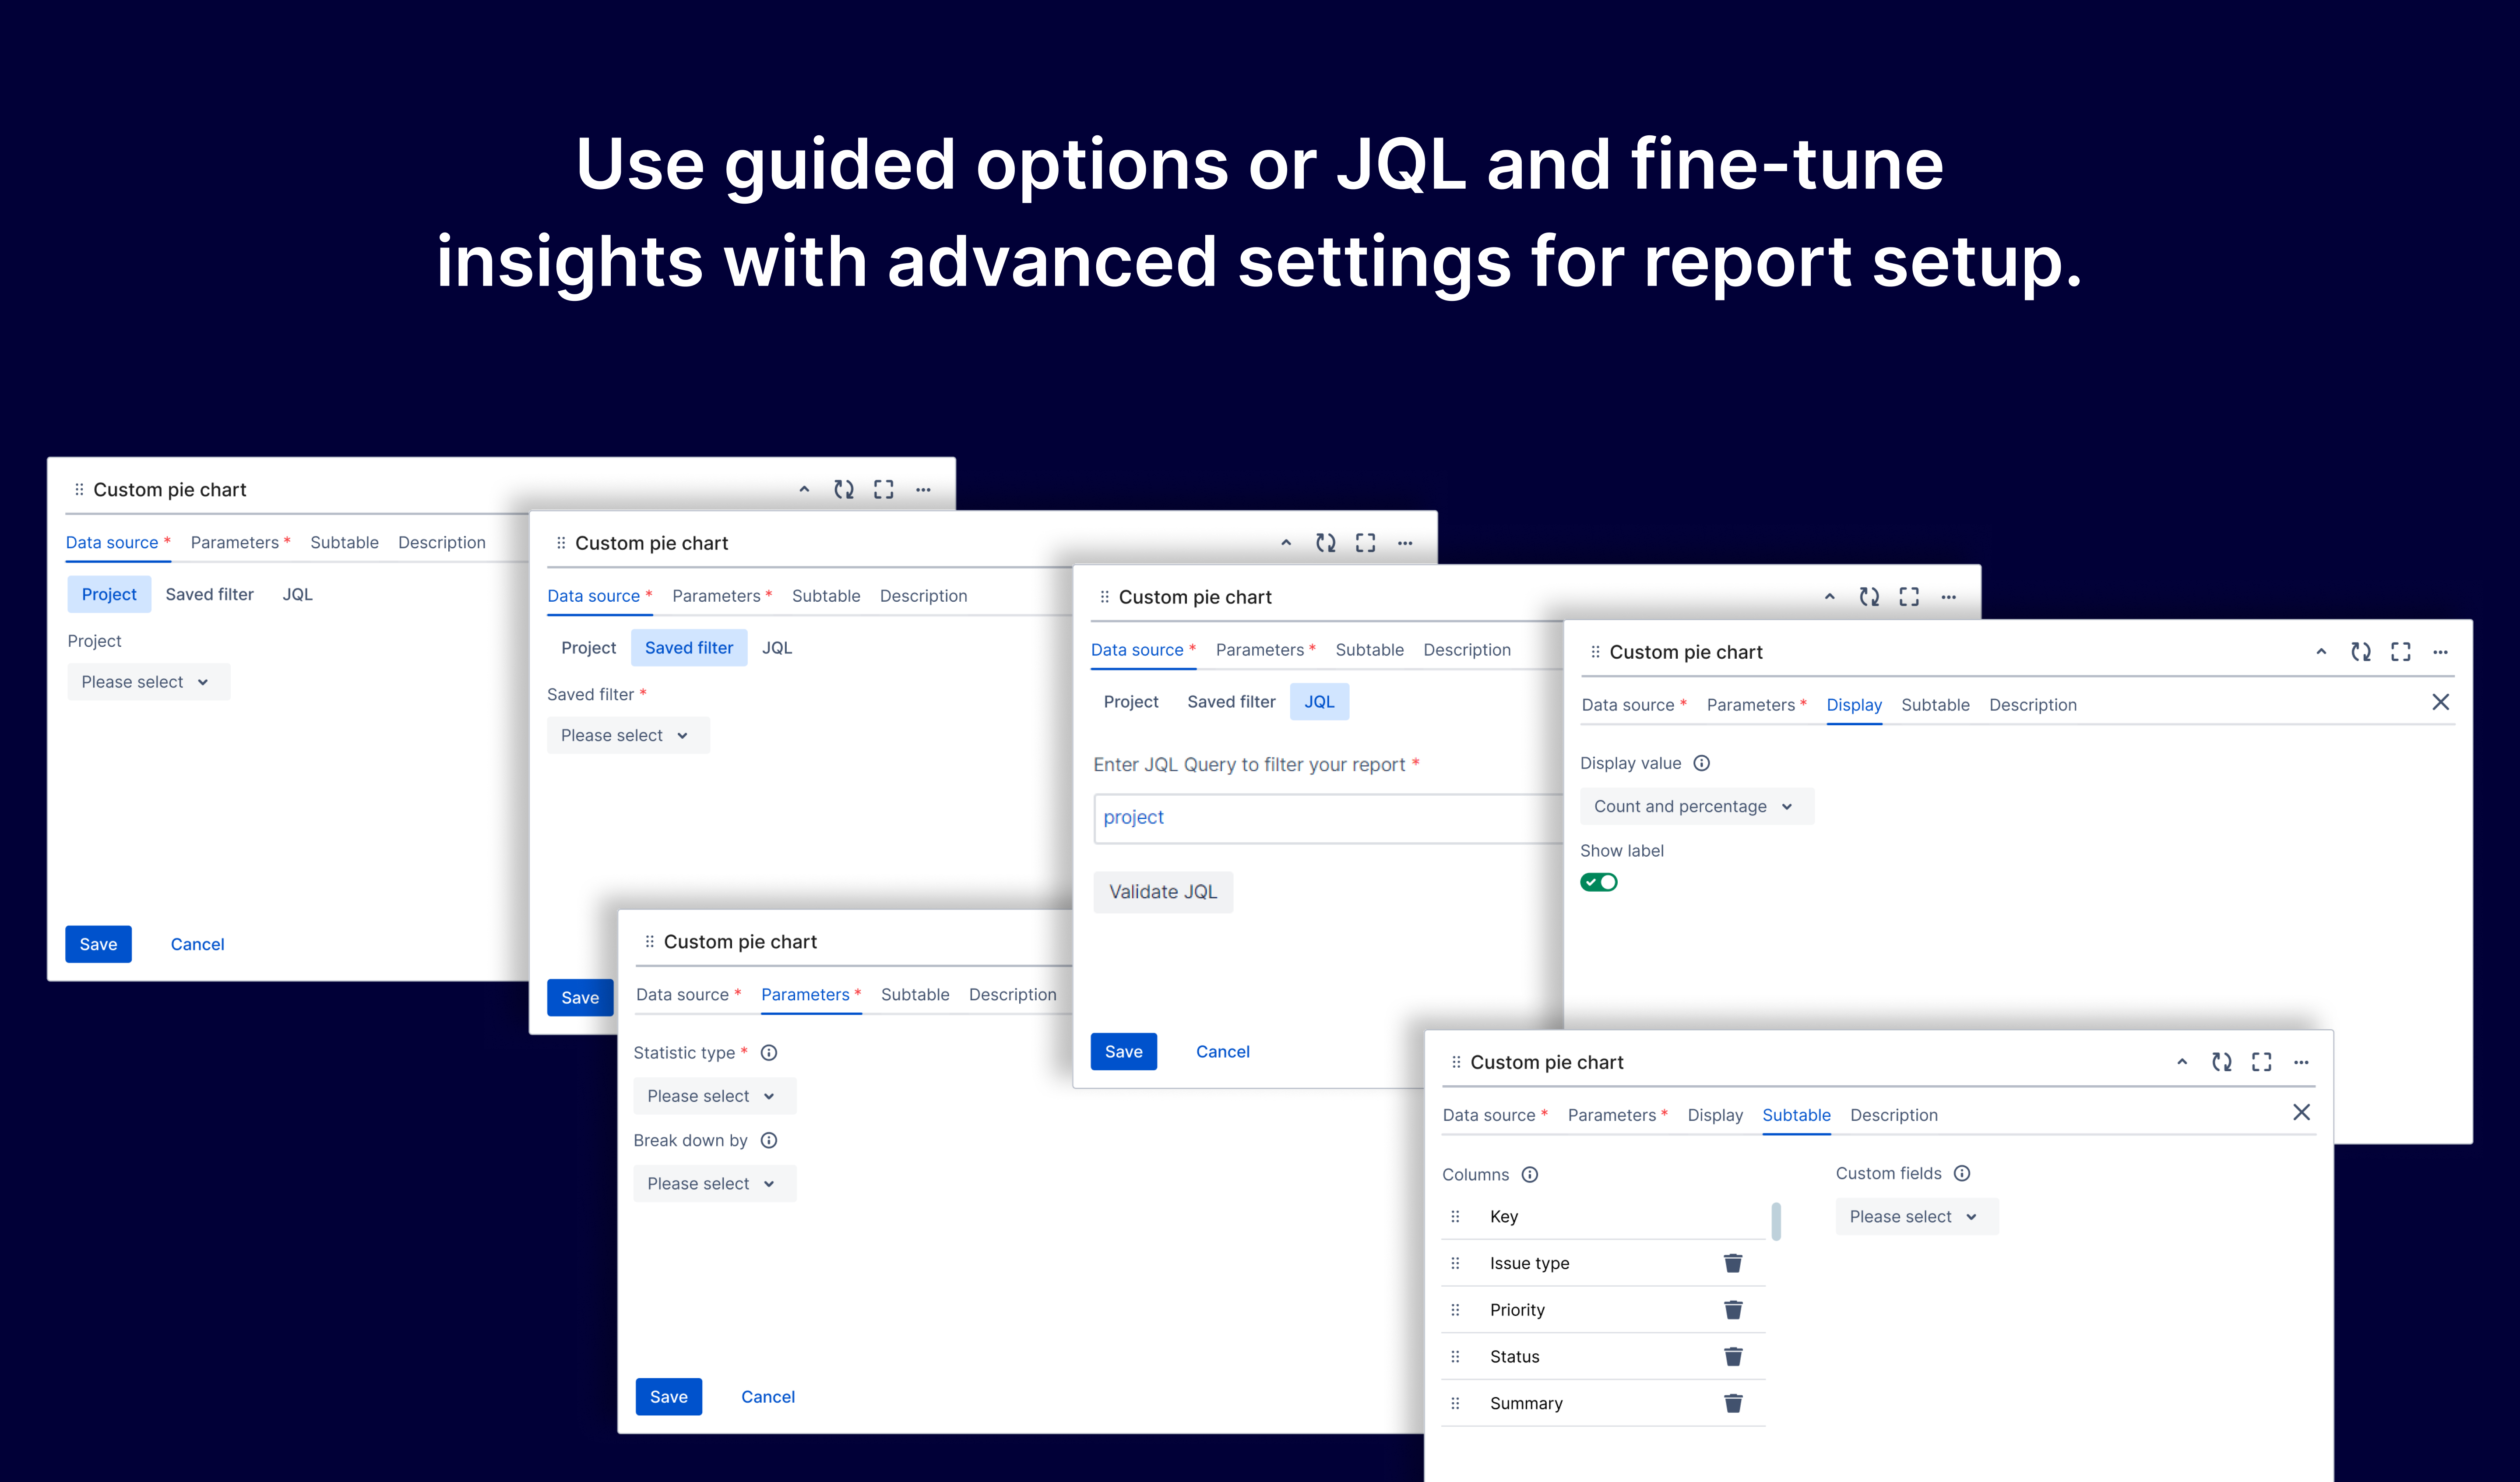
It’s about giving everyone a simple way to:
-
Pull reports for a variety of needs - ranging from standard reports like top-performers insights to structured WBS overviews
-
See metrics updated live from Jira data
-
Avoid context switching or waiting for someone to generate a chart
Practical Use for Everyday Teams
-
Less time wasted building dashboards
-
More clarity on what’s working-and what’s not
-
Shared understanding across teams
-
Fewer misunderstandings around priorities or progress
And most importantly - avoiding missed deadlines by spotting blockers and problems early.
If your team already uses Jira every day, getting useful reports shouldn’t feel like a separate job. Whether you use Report Hub, making key metrics available in two clicks is a powerful way to support your team-without getting in their way.
