Hi!!
I've been working with Team Managed Projects in Jira Work Management and I'm keen on enhancing the project boards and visualization for the different teams I collaborate with.
Currently, I'm facing an issue where the Timeline view in our project doesn't provide a waterfall view of the different epics, tasks and subtasks. Instead, they're presented as a list, which doesn't meet our expectations (please refer to the attached images to compare my reality vs my expectation).
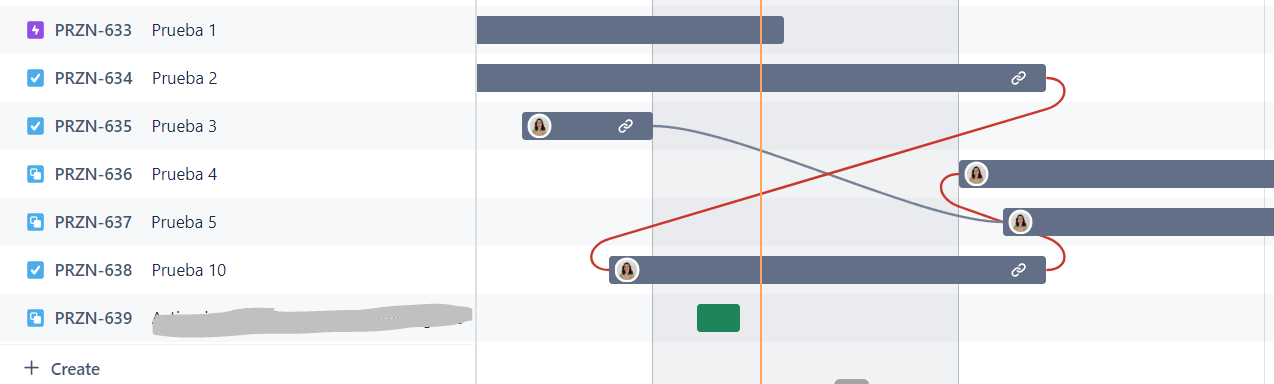
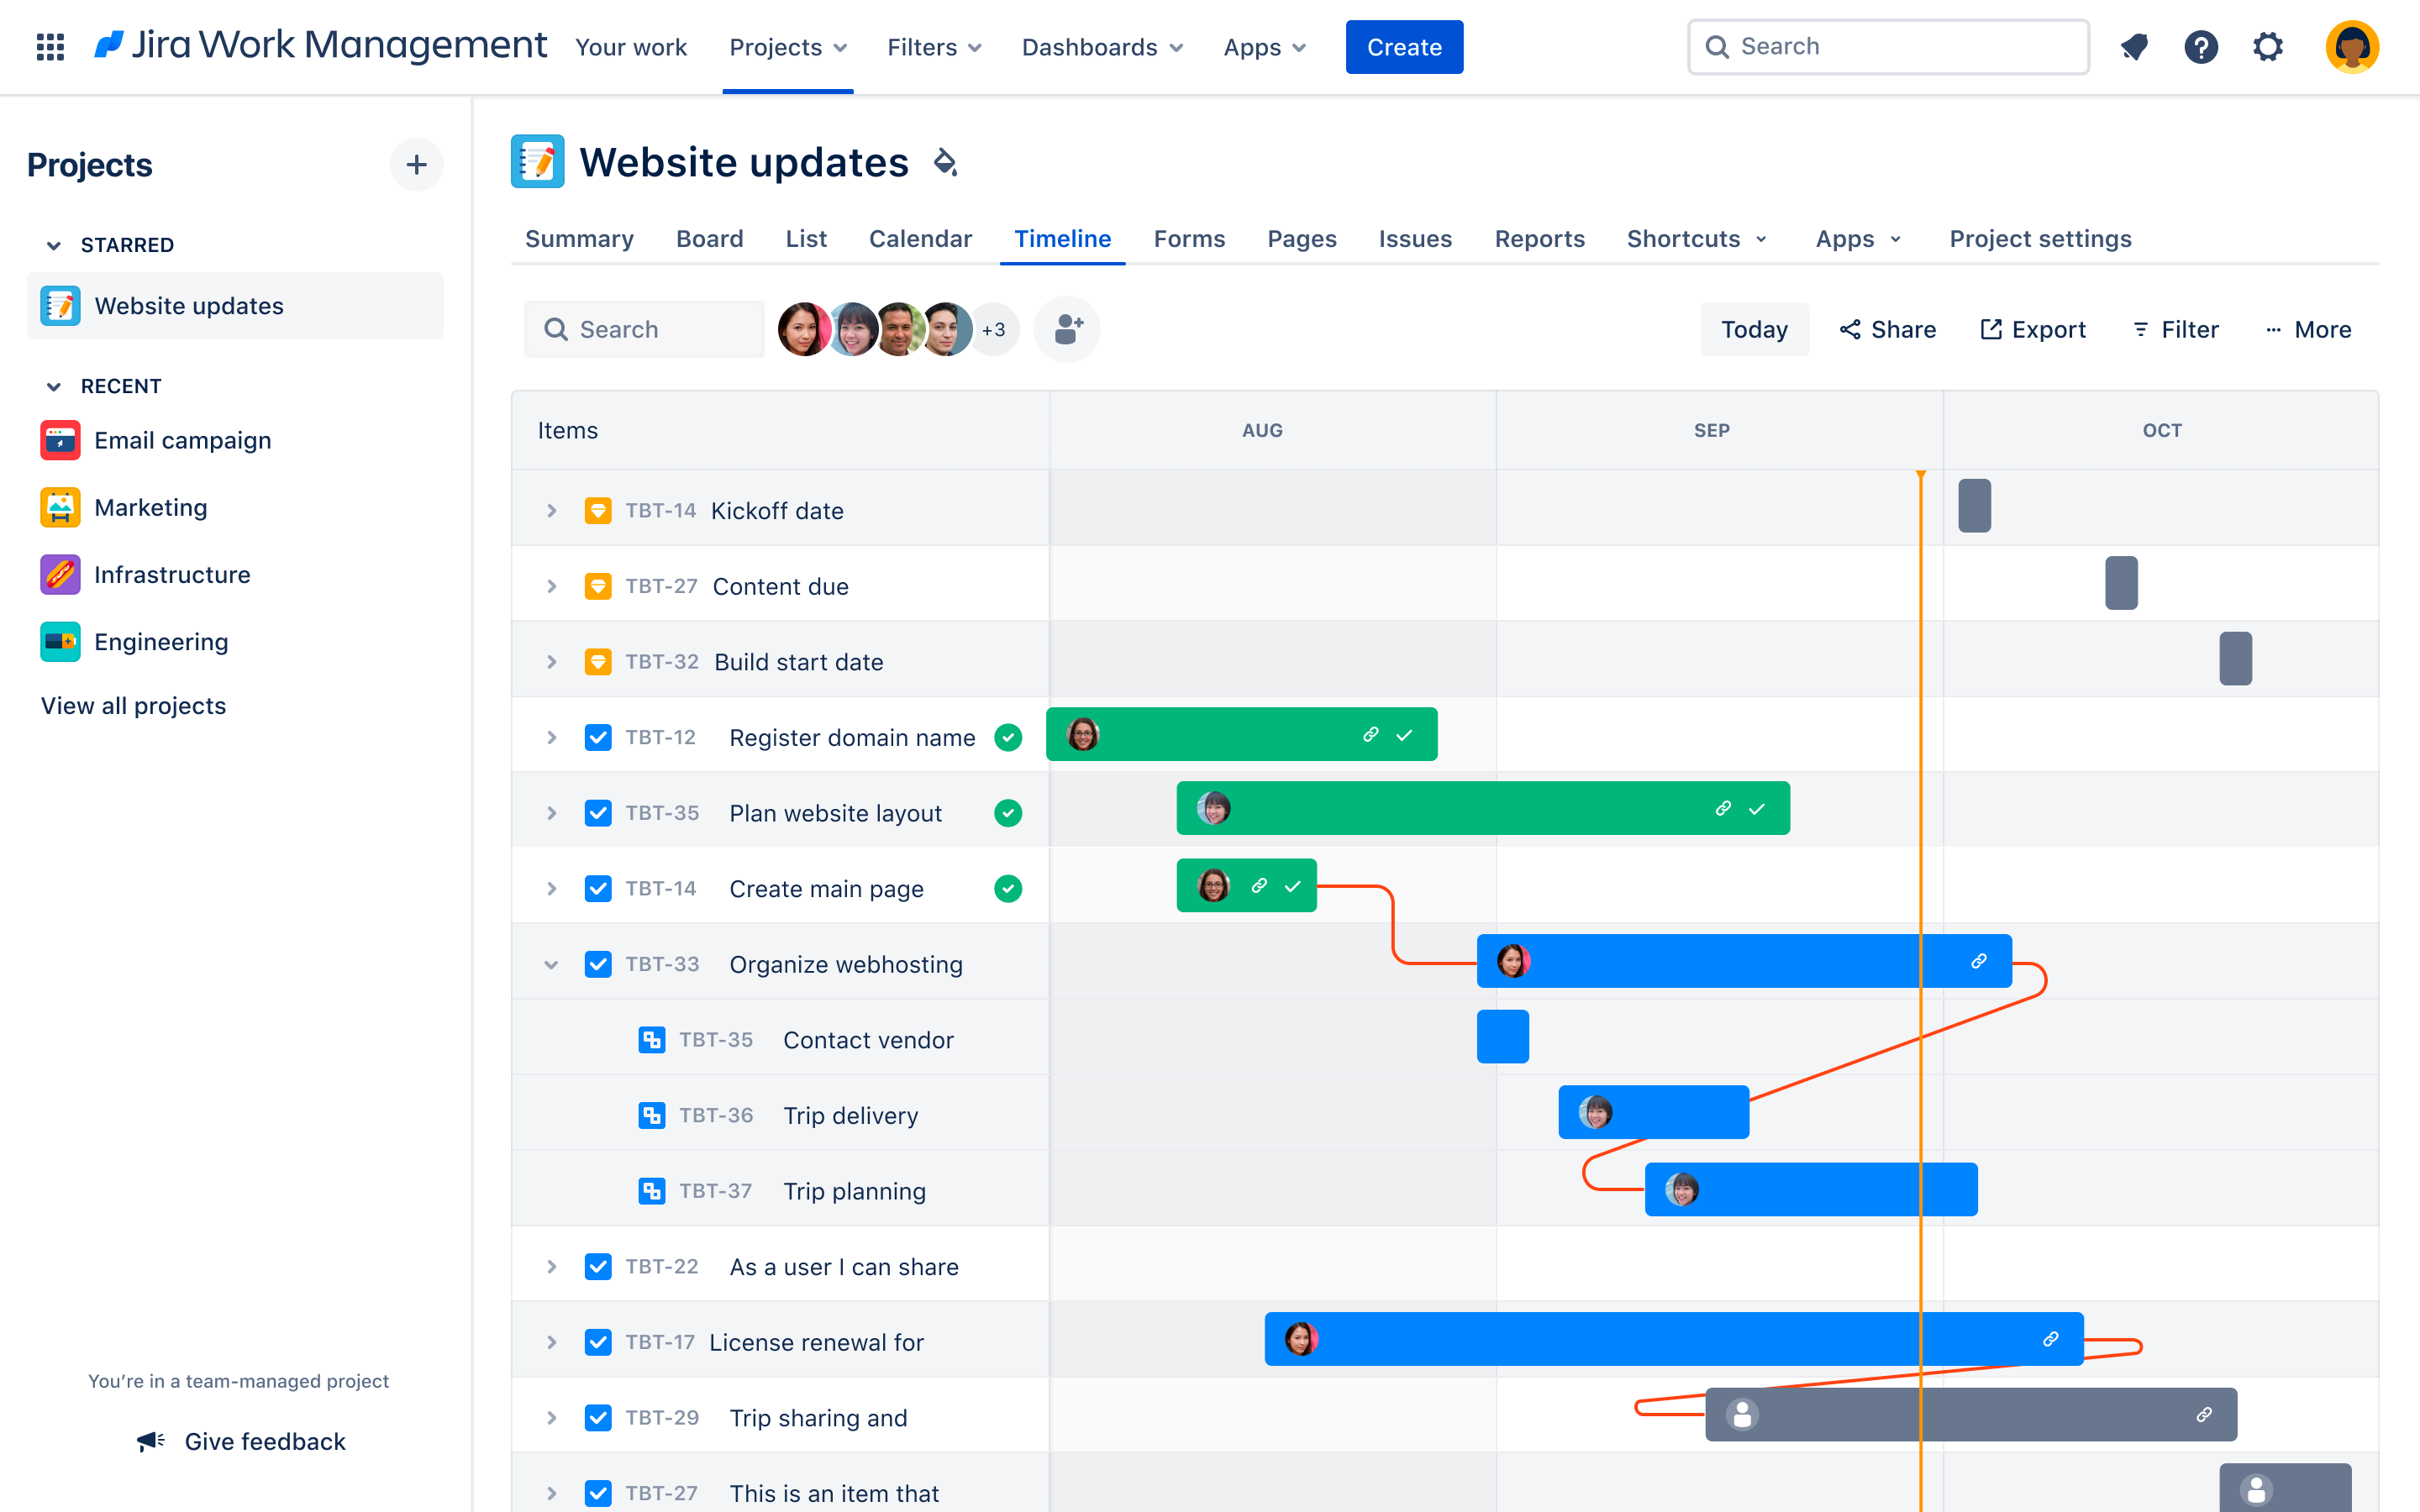
Additionaly, I experimented with WBS Gantt-Chart app. While it allows us to view the issues in a waterfall format, I'm encountering a challenge where the start date - end date colored bars aren't displayed. They appear as red lines, which isn't very user-friendly (refer to the attached image as reference).

I have done my research and I haven't found many resources on this topic. I would greatly appreciate it if anyone has insights, resources, or tutorials they could share regarding this matter.
Thank you!!!

