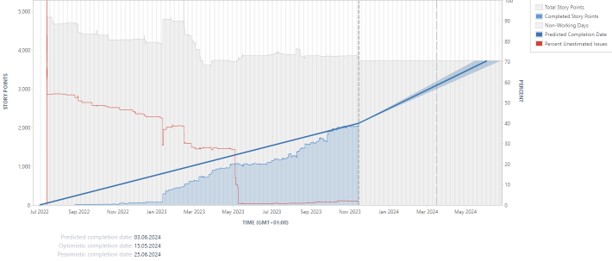
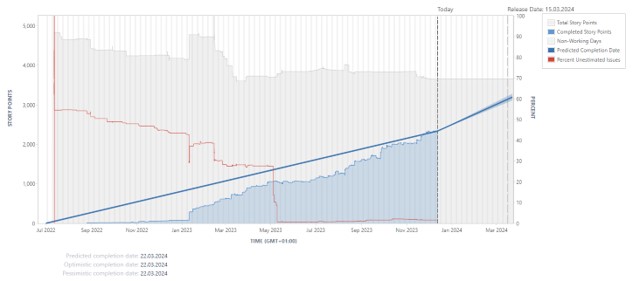
I'm using the version report for a while. Since November last year something changed with the graph and the completion dates. Before the graph for the predicted completion date went to the Total Story Points line (1st picture). Now I don't know what changed in the meanwhile the Predicted Completion Date graph goes just to 60% and ends there. Also the the different completion dates, predicted, optimistic and pessimistic are all identical.
I have this problem just in this release, all my othe releases looks ok.
Do you have an idea what could happen?